
I have experience installing Elastic Cloud on Kubernetes (ECK) using AWS Elastic Kubernetes Service (EKS). But I have never tried a manual install on a server. These are the instructions I ran to get Elasticsearch and Kibana up and running with HTTPS enabled between Kibana and our browser. With the introduction of Elastic Agents, I also provided instructions on setting up a Fleet-server as well as a fleet-managed Elastic Agent on a Windows VM to start collecting logs. Personally I think I would prefer setting up Elastic with Docker, and perhaps I’ll add to this guide to include Docker installation later. But for now I just wanted to try a bare metal install of an Elastic Stack. To mimic installing, configuring, and accessing an Elastic Stack on a server via a cloud provider or anywhere really, I thought it would be beneficial to setup my own server on a VM to test the waters. If you would like to follow along with testing this on an Ubuntu Server VM, you can follow the guide I created here
These are the guides I used to help set this up:
- https://www.elastic.co/guide/en/elastic-stack-get-started/current/get-started-elastic-stack.html
- https://www.elastic.co/guide/en/kibana/current/deb.html
- https://www.elastic.co/guide/en/fleet/master/secure-connections.html#generate-fleet-server-certs
Elasticsearch
First thing’s first, we’ll update and upgrade all of the packages on Ubuntu Server:
1
sudo apt update && sudo apt upgrade -y && sudo apt autoremove -y
With this being Ubuntu, we’ll install using debian packages:
1
2
curl -L -O https://artifacts.elastic.co/downloads/elasticsearch/elasticsearch-8.1.1-amd64.deb
sudo dpkg -i elasticsearch-8.1.1-amd64.deb
The output here is important. You’ll want to make sure you copy and paste this somewhere for reference. It has reference commands to change the superuser password and generating enrollment tokens for Kibana and Elasticsearch. It also contains the built-in elastic superuser password.
If you would like to ensure that Elasticsearch starts automatically when the system boots:
1
2
sudo /bin/systemctl daemon-reload
sudo /bin/systemctl enable elasticsearch.service
To start the Elasticsearch service, run:
1
sudo /bin/systemctl start elasticsearch.service
Open up a second terminal window on your host and attempt to curl the Elasticsearch service using the VMs IP and replace PASSWORD with the password given in the security configuration output when Elasticsearch was installed. You should see a similar output:
1
2
3
4
5
6
7
8
9
10
11
12
13
14
15
16
17
18
$ curl -k -u "elastic:PASSWORD" https://192.168.235.129:9200
{
  "name" : "elastic",
  "cluster_name" : "elasticsearch",
  "cluster_uuid" : "hagNR9aLTLaXk-TQkBnt9w",
  "version" : {
    "number" : "8.1.1",
    "build_flavor" : "default",
    "build_type" : "deb",
    "build_hash" : "d0925dd6f22e07b935750420a3155db6e5c58381",
    "build_date" : "2022-03-17T22:01:32.658689558Z",
    "build_snapshot" : false,
    "lucene_version" : "9.0.0",
    "minimum_wire_compatibility_version" : "7.17.0",
    "minimum_index_compatibility_version" : "7.0.0"
  },
  "tagline" : "You Know, for Search"
}
Now we’ll generate an enrollment token for Kibana. You can reference the security configuration output when we installed Elasticsearch for the command:
1
sudo /usr/share/elasticsearch/bin/elasticsearch-create-enrollment-token -s kibana
Copy the output and save it for use in the next couple of steps.
Kibana
Download and install the Kibana debian package:
1
2
wget https://artifacts.elastic.co/downloads/kibana/kibana-8.1.1-amd64.deb
sudo dpkg -i kibana-8.1.1-amd64.deb
Now run the next command, pasting in the enrollment token when prompted:
1
2
3
4
5
6
7
$ sudo /usr/share/kibana/bin/kibana-setup
? Enter enrollment token: <Enrollment Token String>

✔ Kibana configured successfully.

To start Kibana run:
  bin/kibana
To have Kibana configured to run at startup:
1
2
sudo /bin/systemctl daemon-reload
sudo /bin/systemctl enable kibana.service
Before we start Kibana, we need to configure a few things first. First we need to create some self-signed certs to enable HTTPS between Kibana and our browser, then configure /etc/kibana/kibana.yml to reflect those changes.
To generate self-signed certs using the elasticsearch-certutil binary, run the following. You may choose to add a password to your certificate file:
1
sudo /user/share/elasticsearch/bin/elasticsearch-certutil cert -name kibana-certs --self-signed
For my preference I am going to create a certs directory in /etc/kibana, move the certificate file there, then give ownership of the certs to kibana. That last command is very important:
1
2
sudo mkdir /etc/kibana/certs && sudo mv /usr/share/elasticsearch/kibana-certs.p12 /etc/kibana/ce
rts && sudo chown -R kibana: /etc/kibana/certs
Now we’ll update /etc/kibana/kibana.yml. Add the following:
1
2
3
4
5
server.host: 0.0.0.0
server.ssl.enabled: true
server.ssl.keystore.path: "/etc/kibana/certs/kibana-certs.p12"
# If you didn't give your keystore a passphrase uncomment the next line
#server.ssl.keystore.password: ""
If you added a password to your certificate, add it to kibana’s keystore:
1
sudo /usr/share/kibana/kibana-keystore add server.ssl.keystore.password
We also want to secure the saved objects that are stored in Kibana such as dashboards, visualizations, alerts, actions, and advanced settings. These objects might include sensitive information. To add a layer of protection to these saved objects (which are kept in a dedicated, internal index), we’ll use the kibana-encryption-keys binary to generate keys for us to place inside of kibana.yml.
If you would like to setup key rotation as well, you can follow Elastics Kibana Guide.
1
sudo /usr/share/kibana/bin/kibana-encryption-keys generate -f | tail -4 | sudo tee -a /etc/kibana/kibana.yml &>/dev/null
Finally we’ll start Kibana
1
sudo /bin/systemctl start kibana.service
If everything worked correctly, you can open up a browser on your host and type in https://SERVER_IP:5601. You should be greeted with a “Your connection is not secure” warning. That’s okay, because these are self-signed certificates that you created. Accept the risk and proceed to starting out with Elastic!
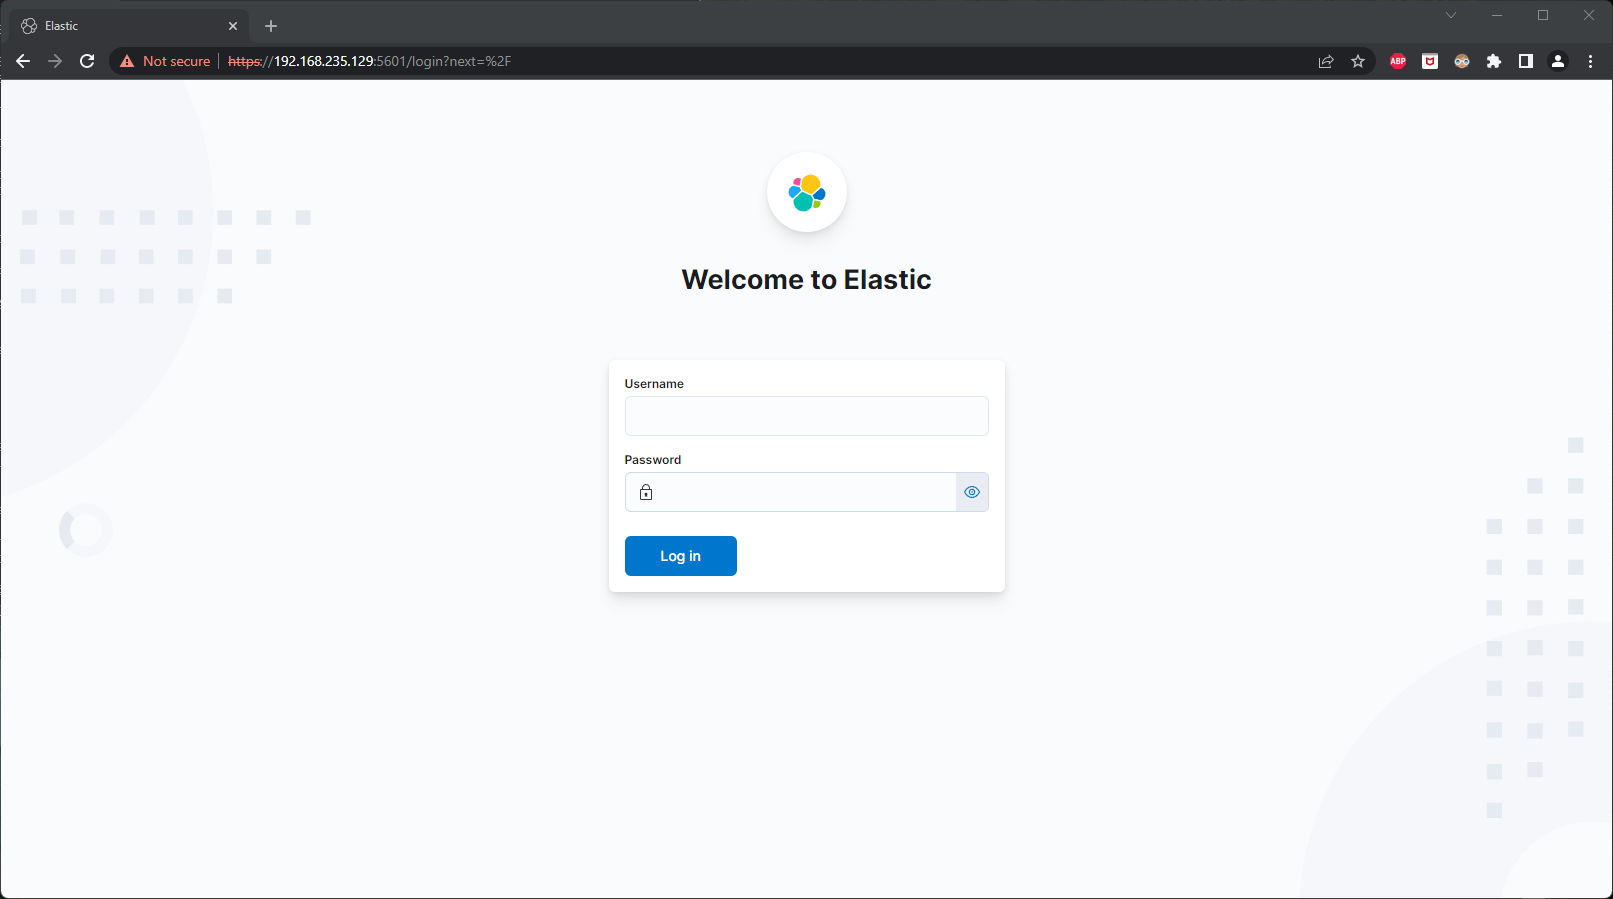
We can sign in with user elastic and the password given to us from the security configuration output when we installed Elasticsearch.
Fleet Server
Download and install the Elastic Agent Debian package:
1
2
curl -L -O https://artifacts.elastic.co/downloads/beats/elastic-agent/elastic-agent-8.1.1-amd64.deb
sudo dpkg -i elastic-agent-8.1.1-amd64.deb
Now we’ll follow this guide to setup TLS communication with the fleet server. Elastic Agents require a PEM formatted certificate so we’ll start off with creating a CA for our fleet server certificates:
1
2
3
4
sudo /usr/share/elasticsearch/bin/elasticsearch-certutil -s ca \
--pem --out /etc/elasticsearch/certs/ca.zip
sudo unzip -q /etc/elasticsearch/certs/ca.zip -d /etc/elasticsearch/certs/
sudo rm /etc/elasticsearch/certs/ca.zip
If you need to install unzip, run
sudo apt install unzip
With CA certificates, we can create certificates for our fleet server:
1
2
3
4
5
6
sudo /usr/share/elasticsearch/bin/elasticsearch-certutil cert -s \
--name fleet-server --ca-cert /etc/elasticsearch/certs/ca/ca.crt \
--ca-key /etc/elasticsearch/certs/ca/ca.key \
--out /etc/elastic-agent/certs/fleet-server.zip --pem
sudo unzip /etc/elastic-agent/certs/fleet-server.zip -d /etc/elastic-agent/certs/ &>/dev/null
sudo rm /etc/elastic-agent/certs/fleet-server.zip
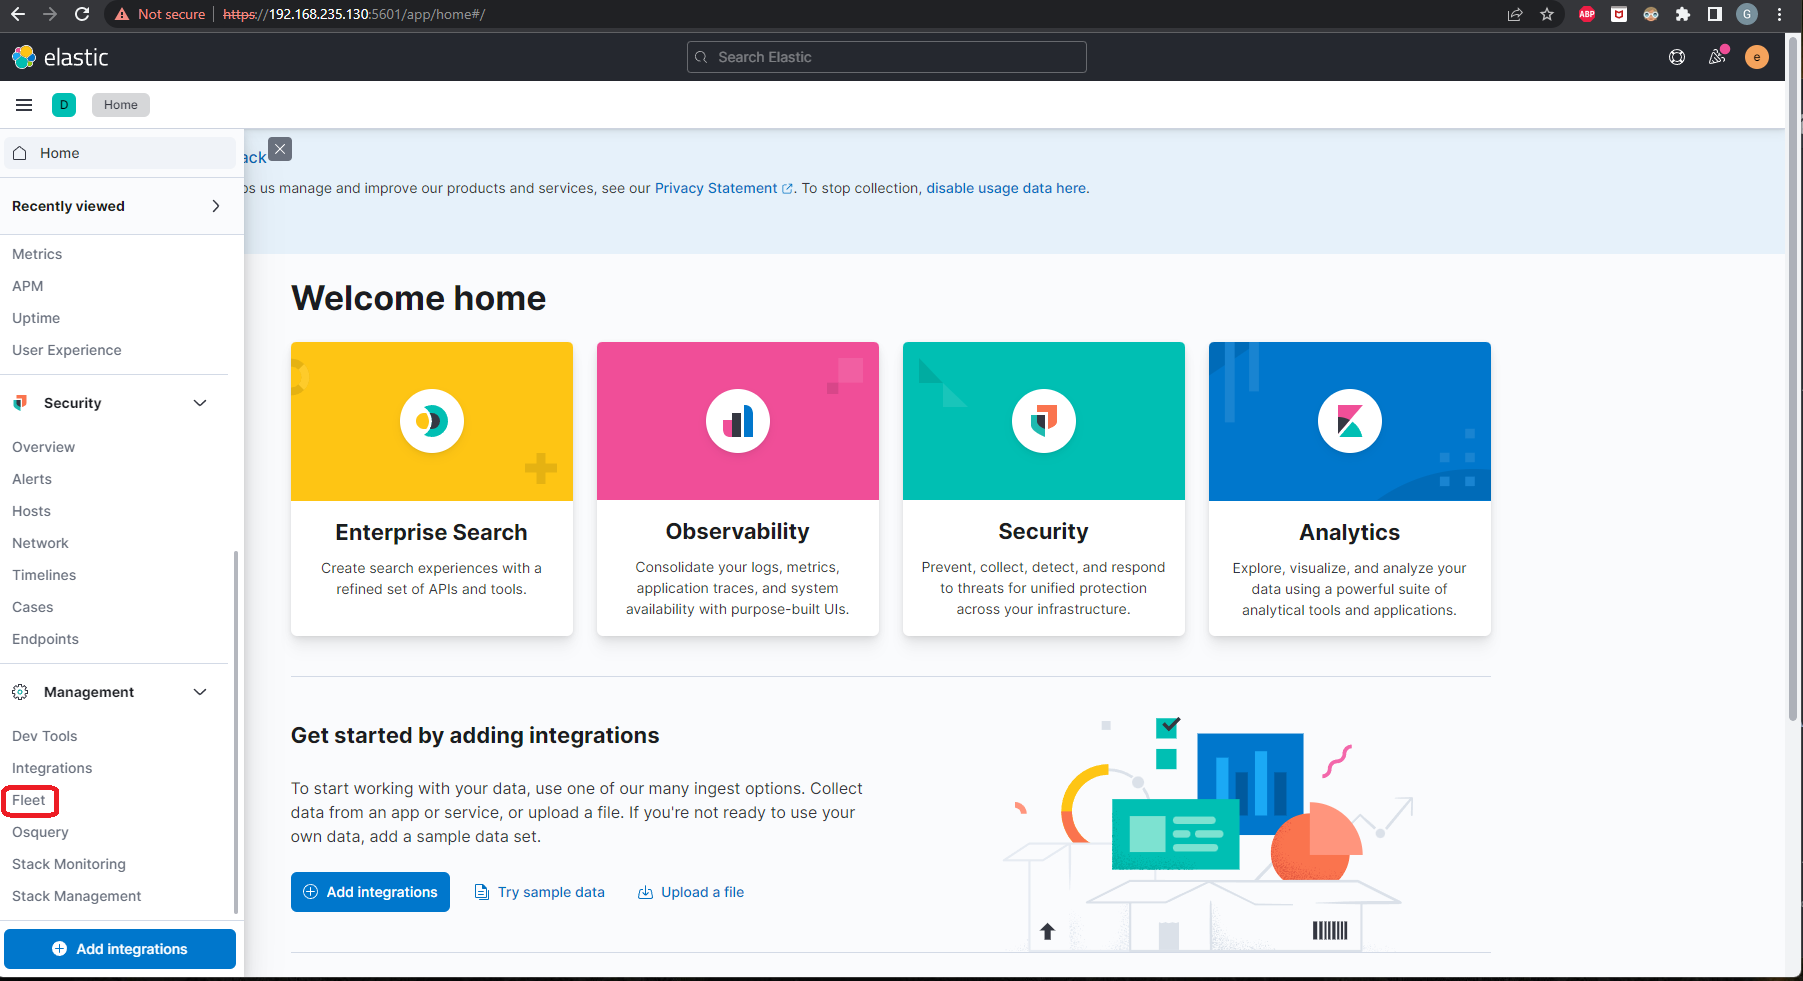
Next let’s login to Kibana and under Management, click on Fleet
There will be a page with steps showing how to add a Fleet Server. They’re pretty straight forward, but will need a bit of modification. Right now, there are no fleet server policies. So on Step 1, be sure to click on Create Policy. If you would like to change what logs the agent will collect, you can select/deselect Collect system logs and metrics and/or under Advanced options -> Agent monitoring you can select/deselect Collect agent logs and Collect agent metrics.
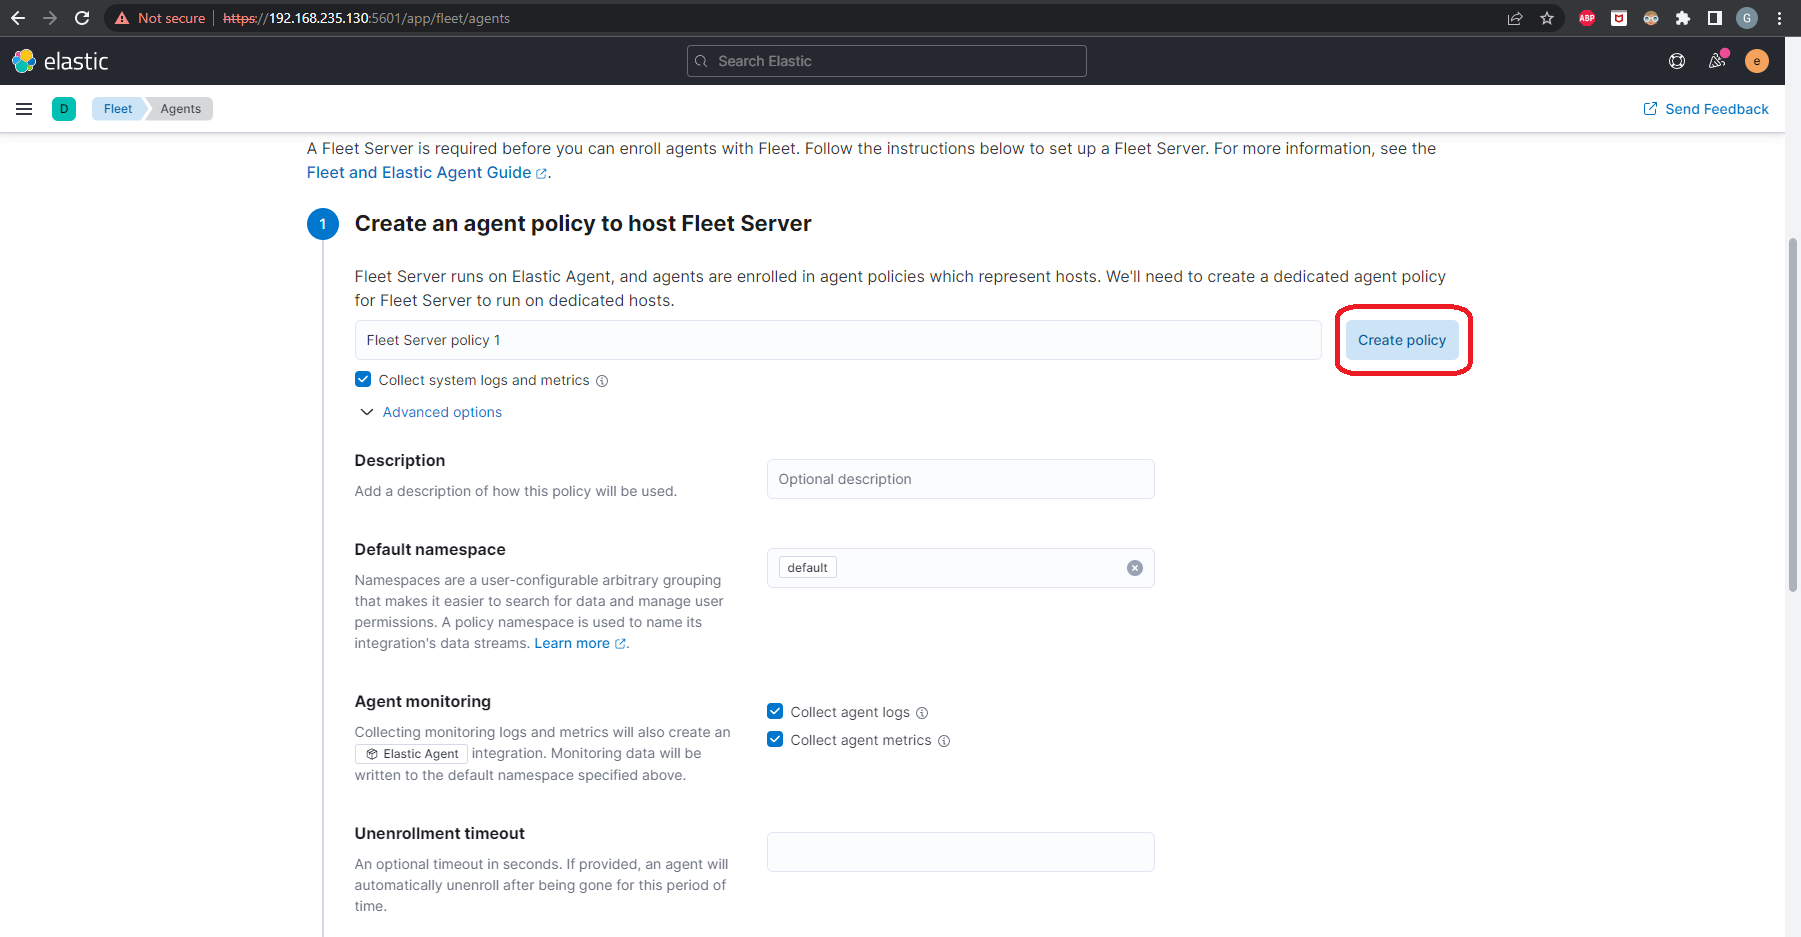
Ignore Step 2, because we have already downloaded and installed Elastic Agent
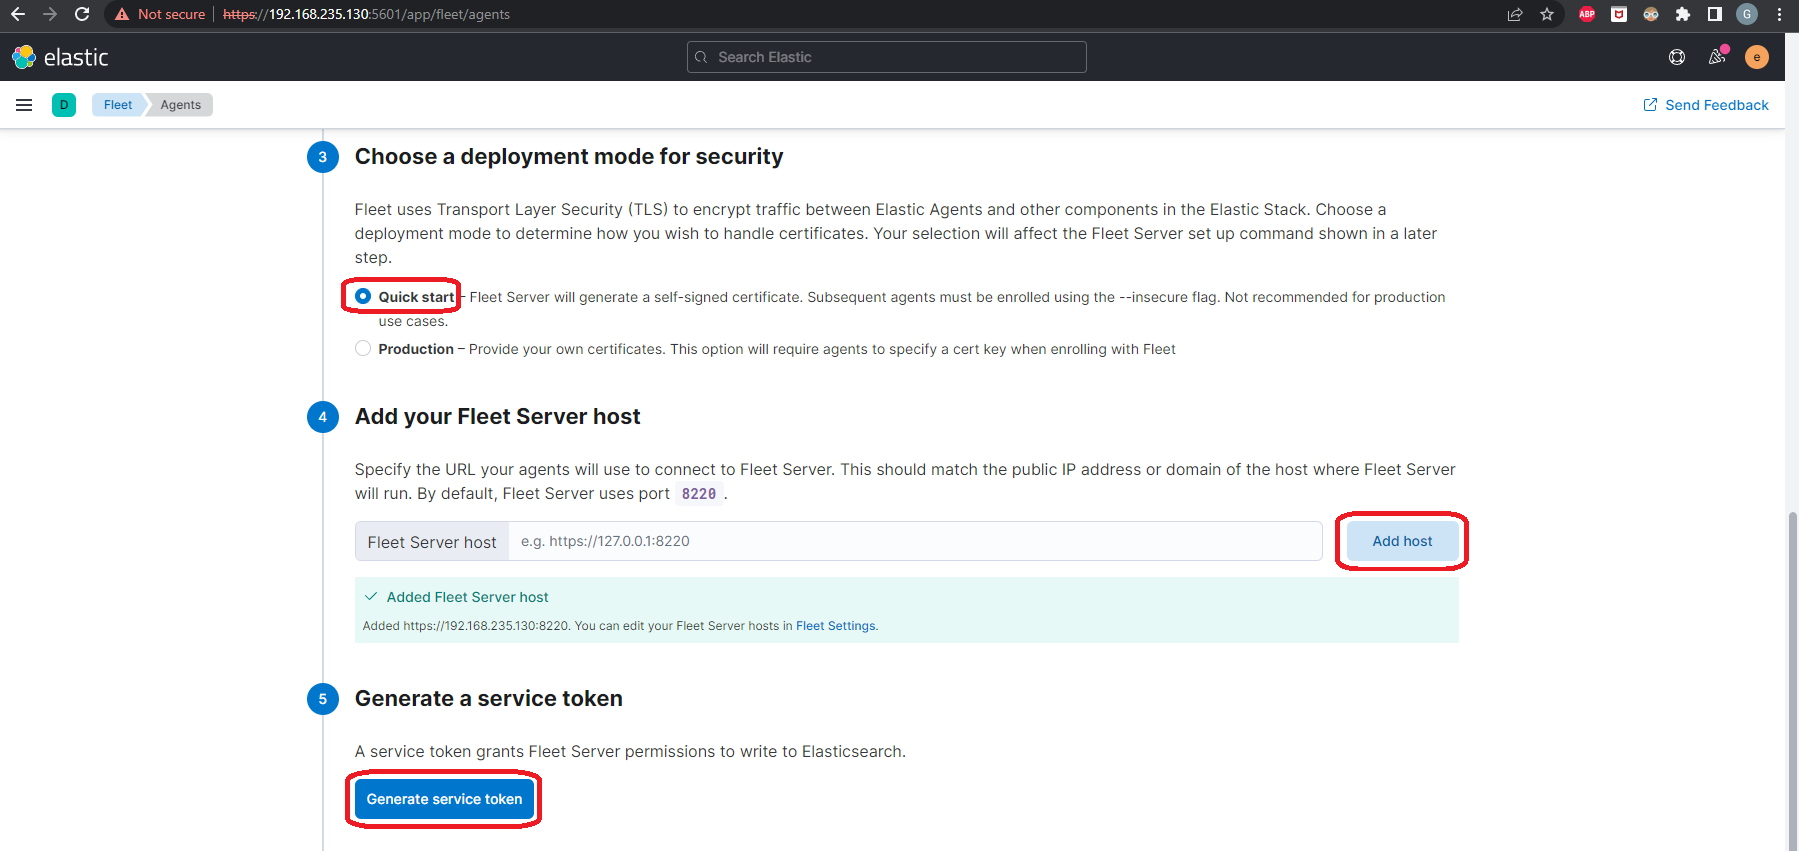
On Step 3, we’ll choose the Quick start deployment type. On Step 4, since our Fleet Server will be installed on the same server as our stack, we’ll use our server IP as our Fleet Server host (https://SERVER_IP:8220). Be sure to click Add host. On Step 5, click Generate service token
Now we come to the last step. Here’s where we’ll change a few things. We’ll need to add our certificates we created for our Fleet Server. And since this is a Debian package installation of Elastic Agent, we’ll need to use enroll instead of install and we’ll have to manually start the Elastic Agent after the Agent enrolls.
Here is the template to enroll the agent:
1
2
3
4
5
6
7
8
9
sudo elastic-agent enroll -f \
--url=https://192.168.235.130:8220 \
--fleet-server-es=https://192.168.235.130:9200 \
--fleet-server-service-token=AAEAAWVsYXN0aWMvZmxlZXQtc2VydmVyL3Rva2VuLTE2NDg0MDQ5MjQ0OTg6cWRjN0lLNWZTaDJJbnVkb0NWTTgzQQ \
--fleet-server-policy=fleet-server-policy \
--fleet-server-es-ca-trusted-fingerprint=dd9d32e7c53bbc30c56a740db3752c01db7545d5bb9c8e951fc446747994192c \
--certificate-authorities=/etc/elasticsearch/certs/ca/ca.crt \
--fleet-server-cert=/etc/elastic-agent/certs/fleet-server/fleet-server.crt \
--fleet-server-cert-key=/etc/elastic-agent/certs/fleet-server/fleet-server.key
Step 6 provides the necessary info for the variables (SERVER_IP, FLEET_SERVICE_TOKEN, and ELASTICSEARCH_CA_FINGERPRINT) that need replacing. If you have followed the guide exactly so far, the certificate and keys should be in the same place.
Replace the needed values and paste the command into the server where Agent is installed and run it.
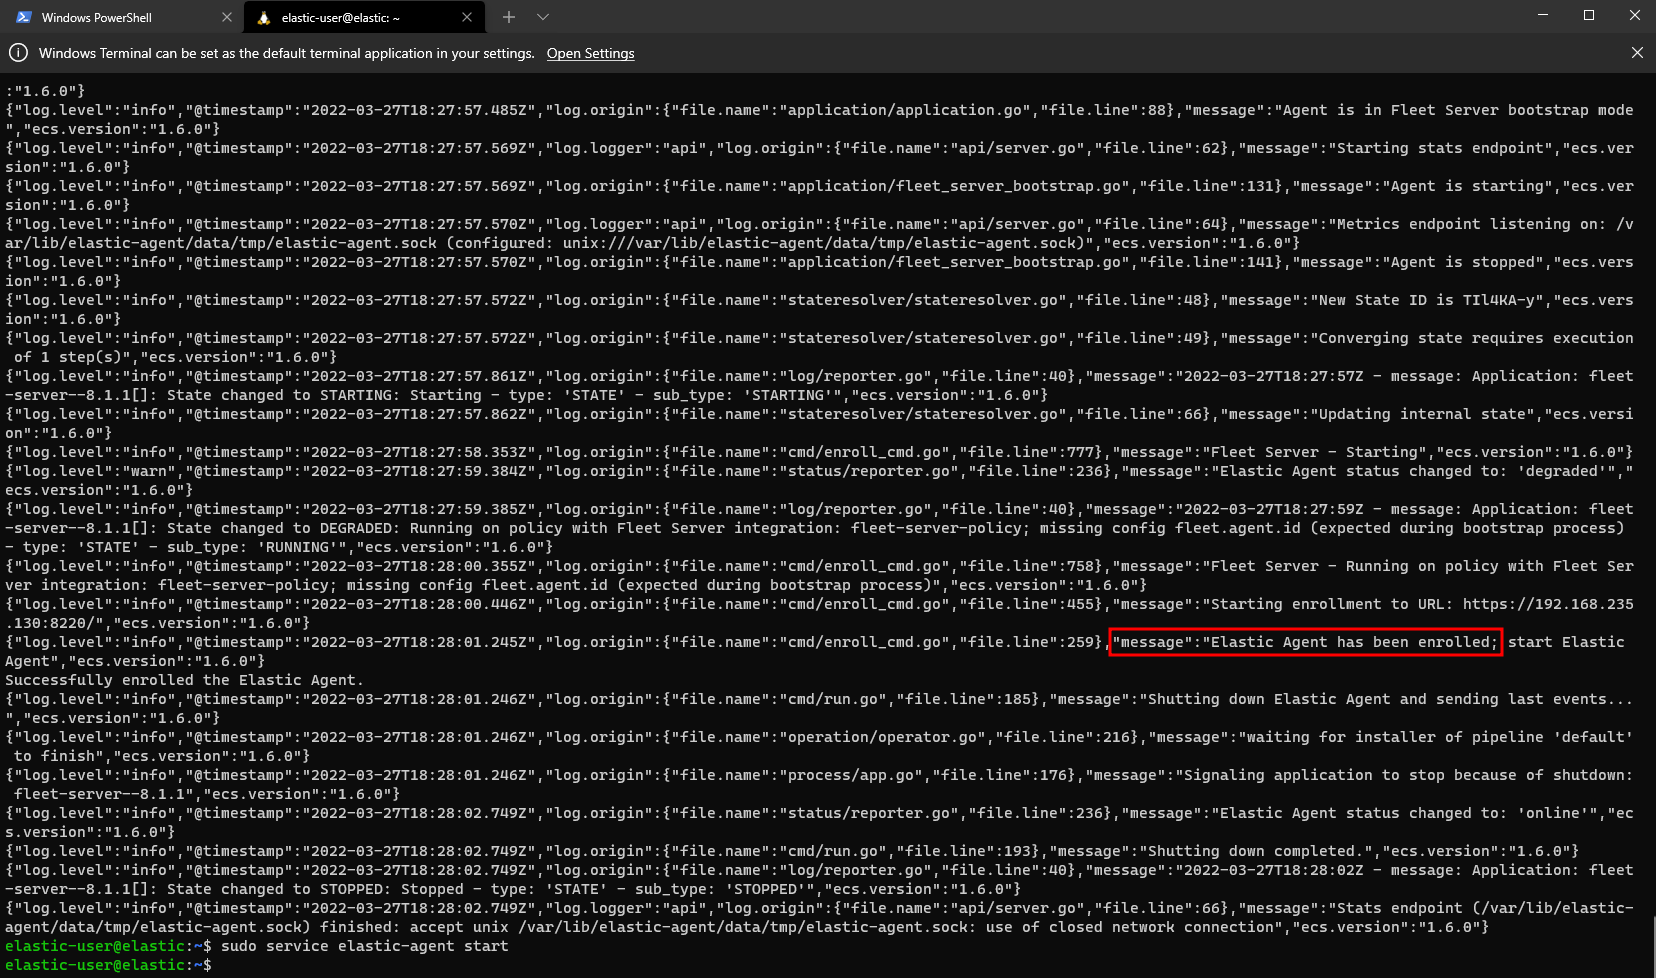
You should see a message that reads Elastic Agent has been enrolled. If you see that, now all that needs to happen is to start the Agent:
1
sudo service elastic-agent start
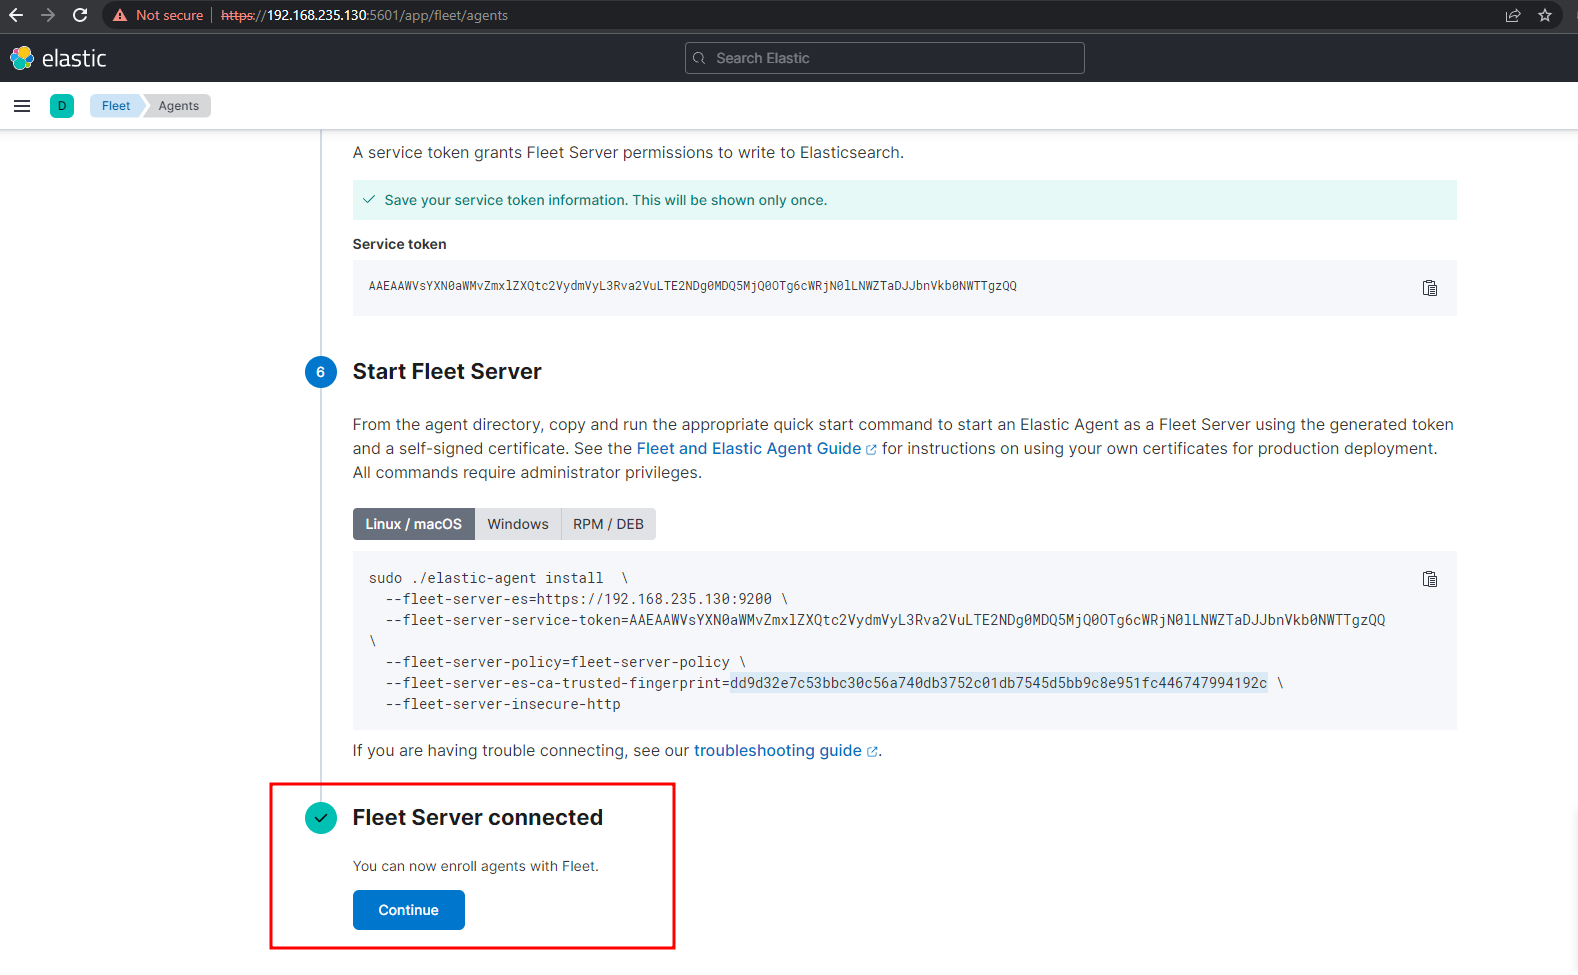
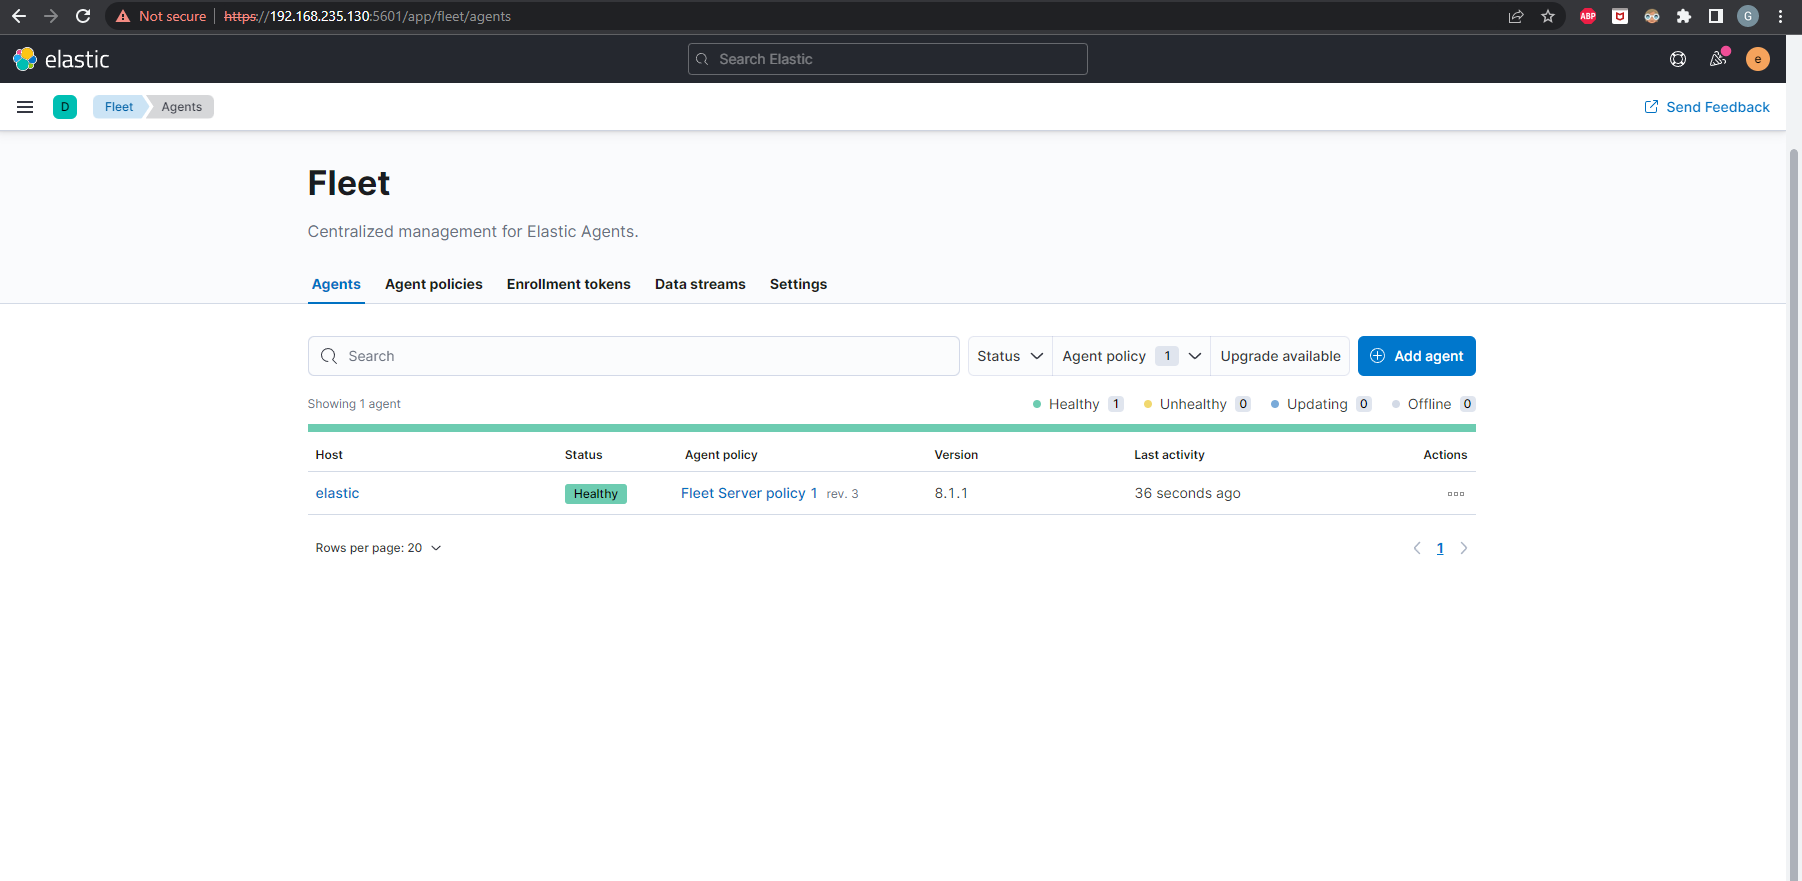
If we go back to Kibana, we should see that the Fleet Server has connected. Click continue and now we can view our Agent(s)!
Elastic Agent
With our Fleet Server up and running, we can now install Agents on systems we want to monitor and have them managed by our Fleet Server. For this Example, I’m going to test this on a Windows 11 VM. You can download an image here: https://developer.microsoft.com/en-us/windows/downloads/virtual-machines/. Just remember to ensure that the Network is configured for NAT just like the Ubuntu Server if you’re following along with the Ubuntu Server VM setup.
I would also like to try out the Network Packet Capture integration, which for Windows requires Npcap to be installed. Then we’ll also need to download Packetbeat. Here is a list items that needs to be downloaded on the Windows host:
First we’ll install Npcap on Windows. Install it with all of the selected defaults. Keep hitting Next until it finishes.
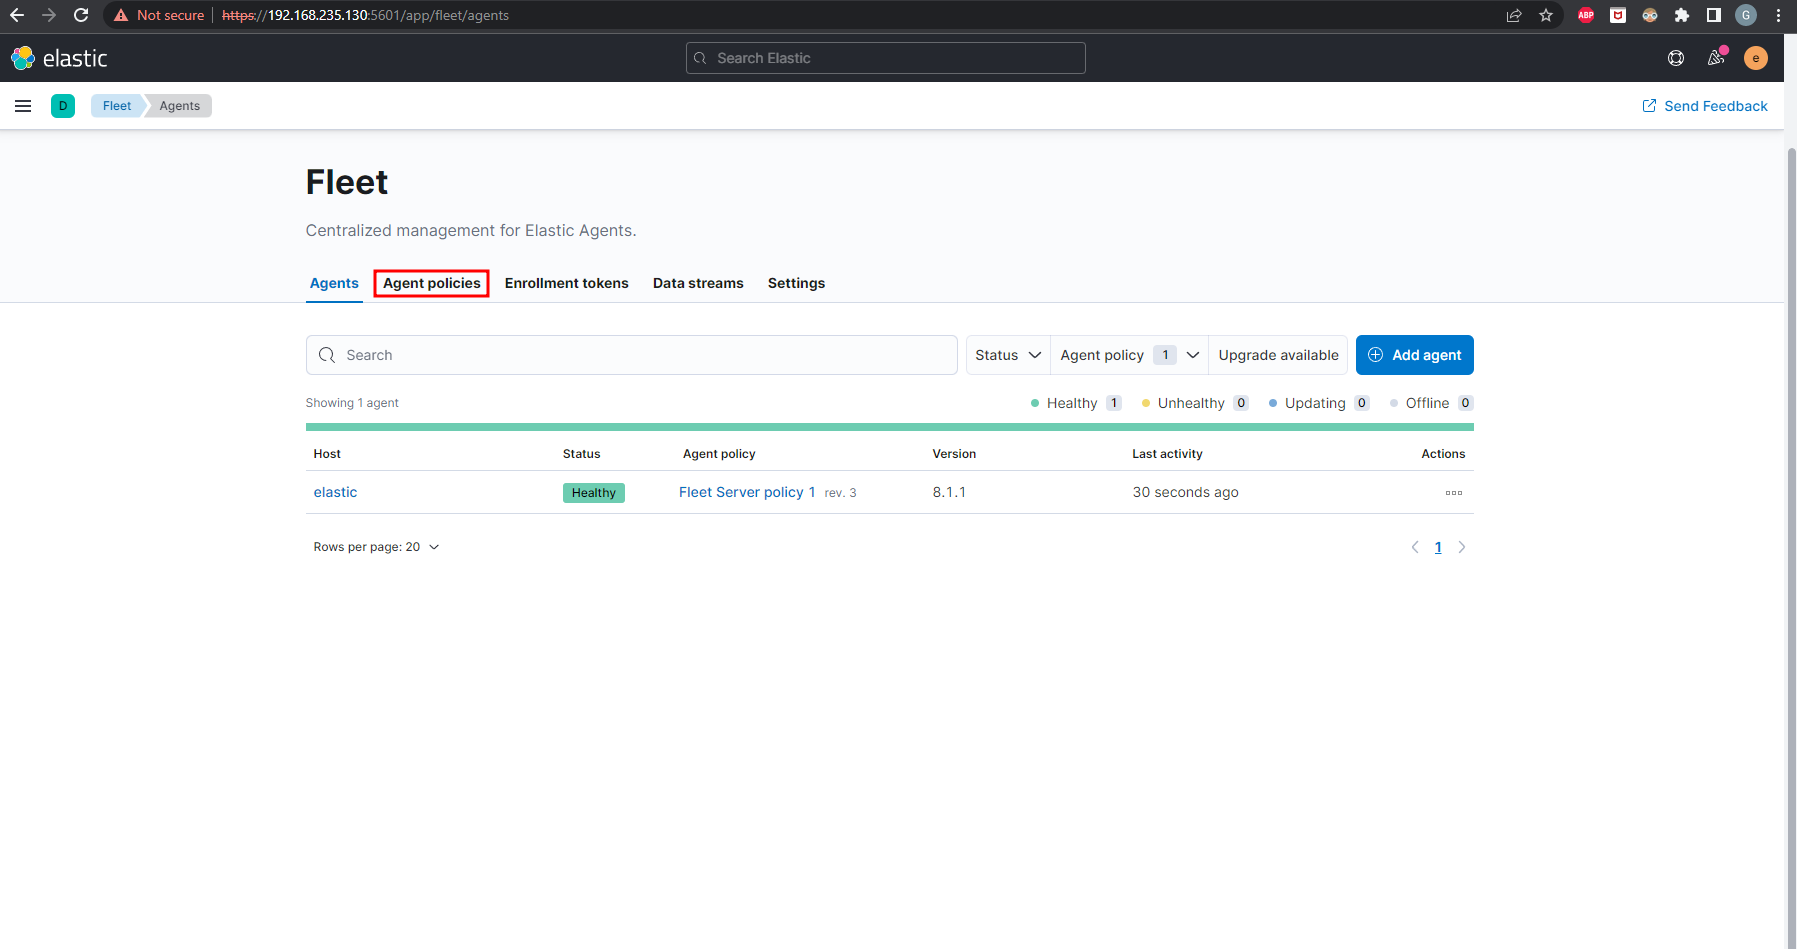
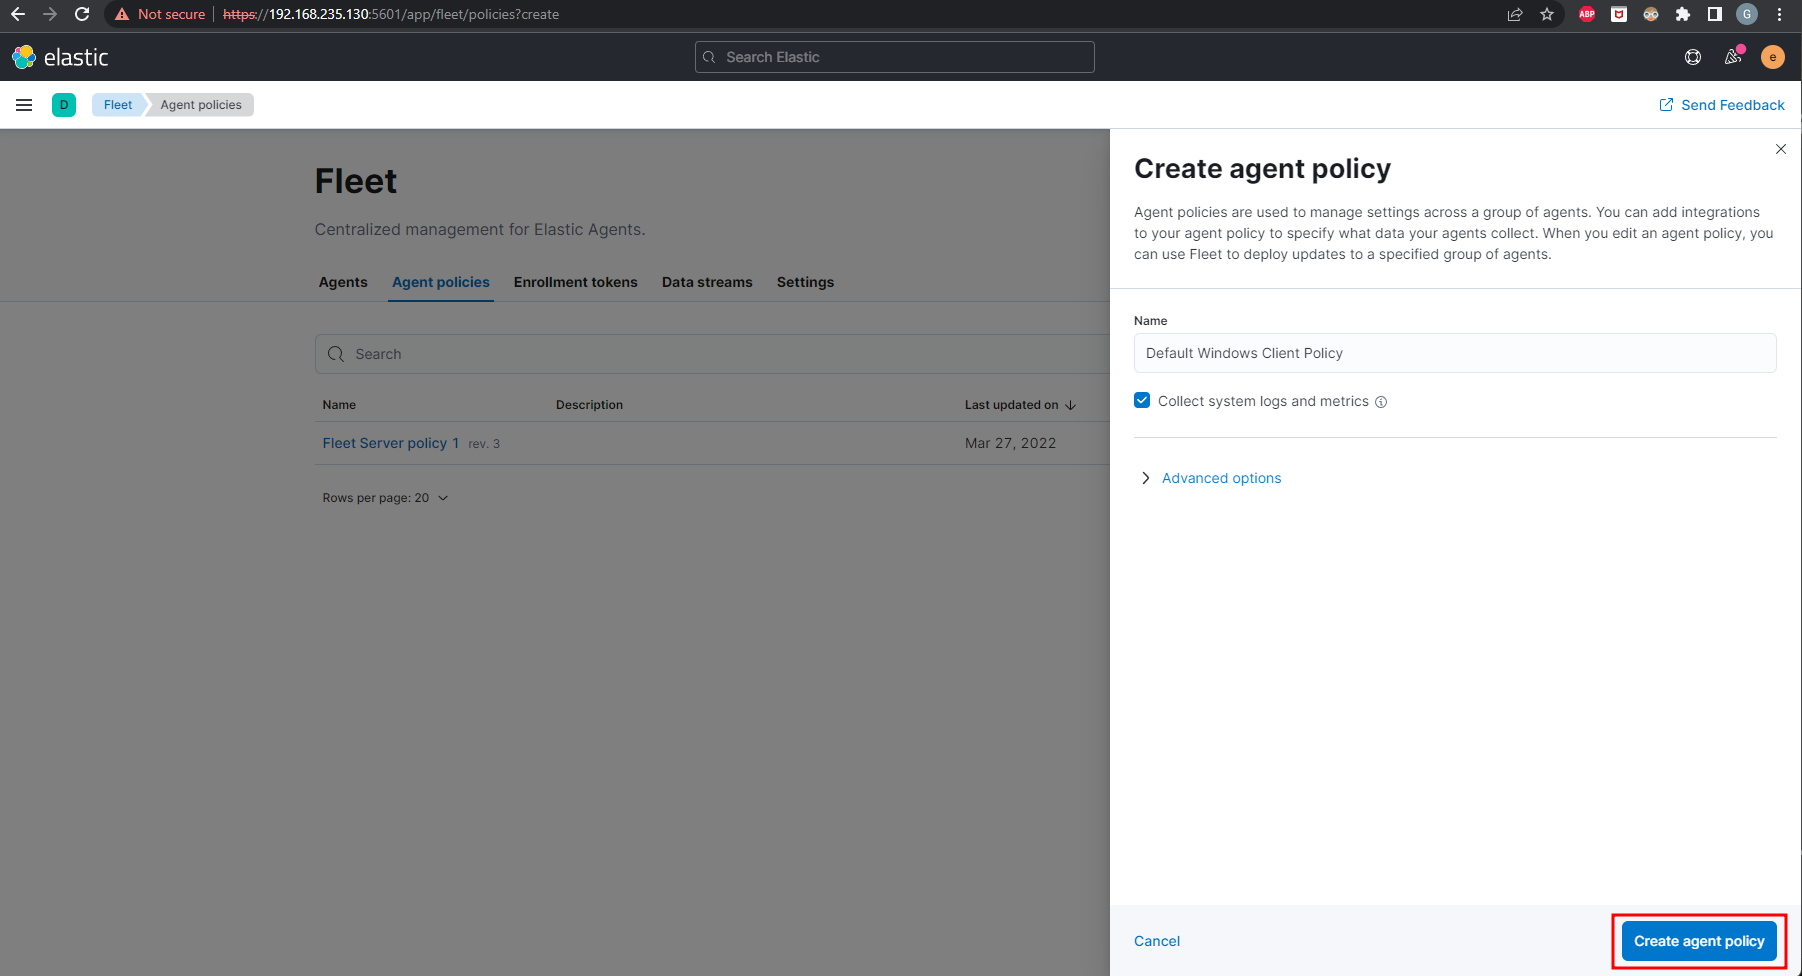
Our Agent will need a policy to enroll in. Then we can add integrations to that policy. In Kibana go back to Fleet and click on Agent policies then Create agent policy

Give the policy a name and click Create agent policy.
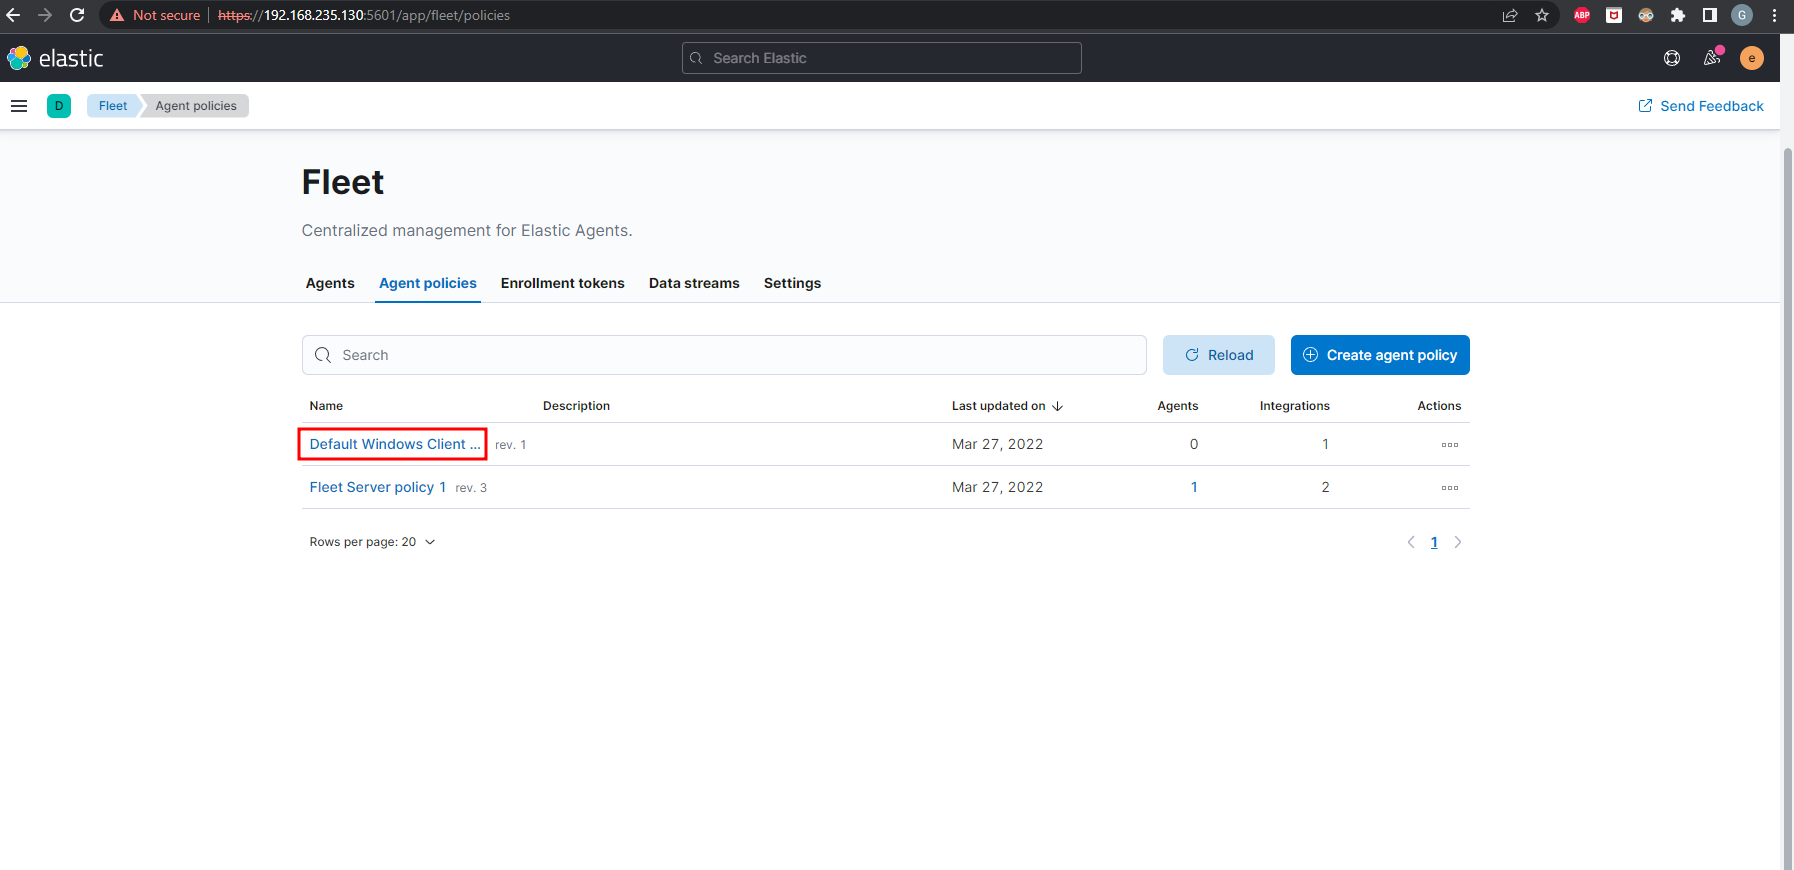
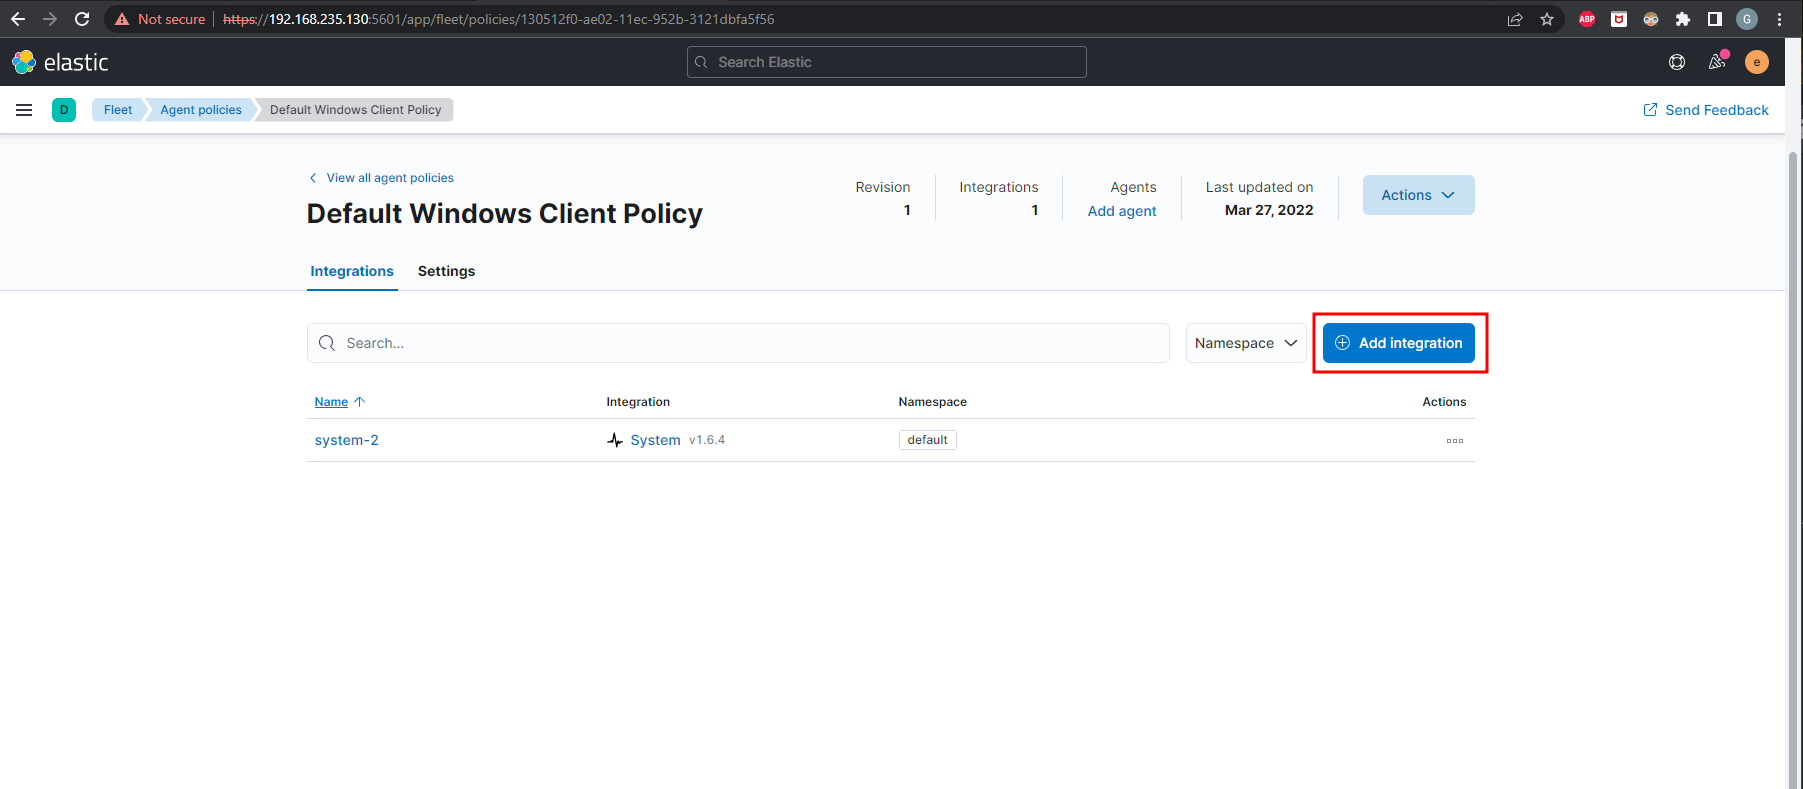
Once the policy is created, click on the policy name then click Add integration
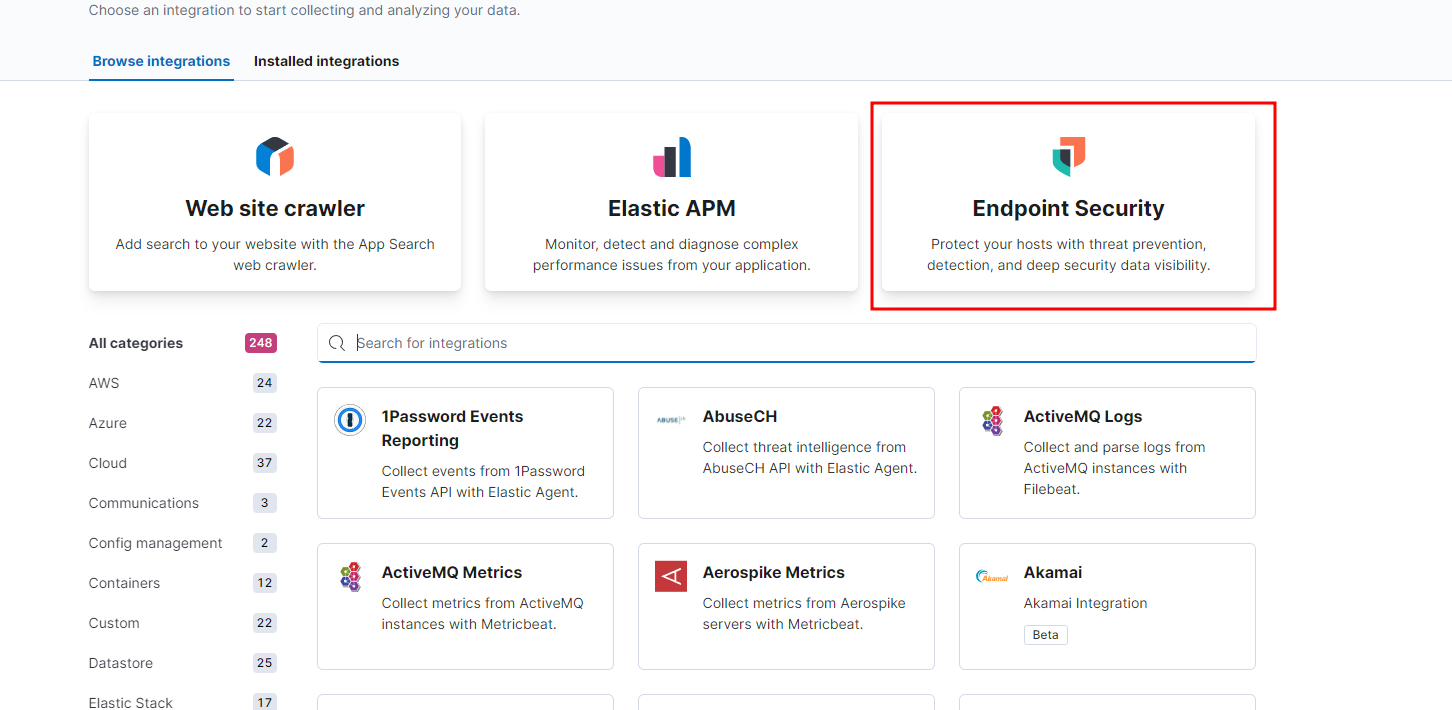
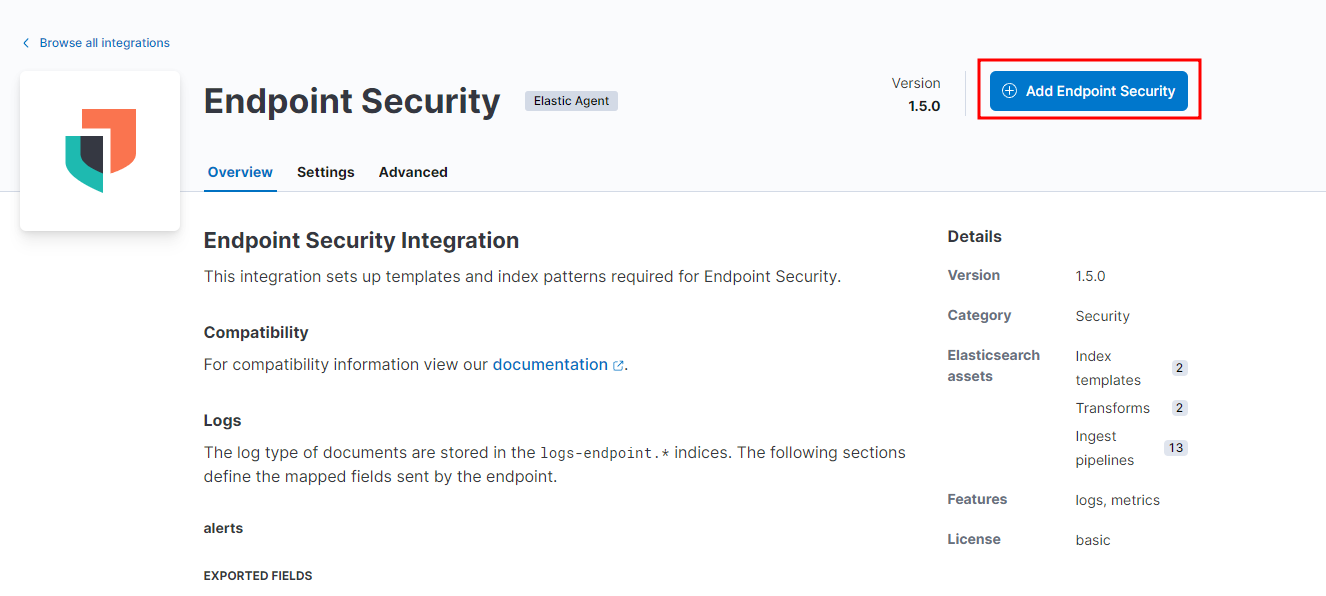
The integrations I’d like to add are the Endpoint Security as well as the Network Packet Capture. Endpoint Security should be at the top of the integration page. Click on it then click Add Endpoint Security
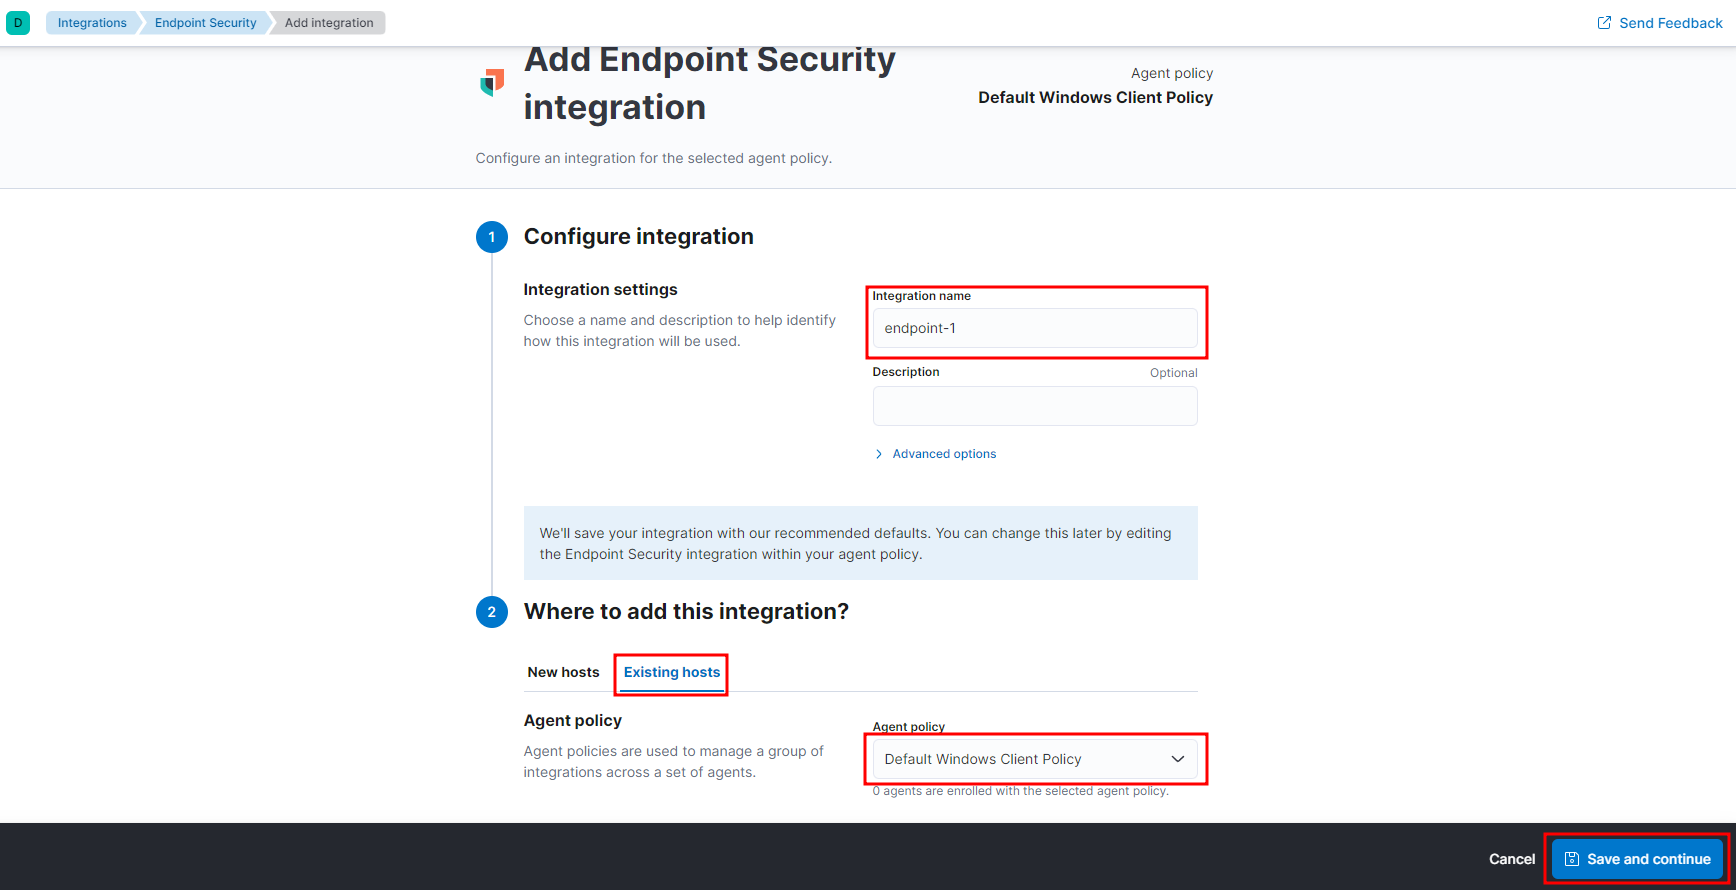
In Step 1 give the Integration a name. In Step 2, make sure that the tab Existing hosts is selected and the policy that we created is selected in Agent policy. Then click Save and continue
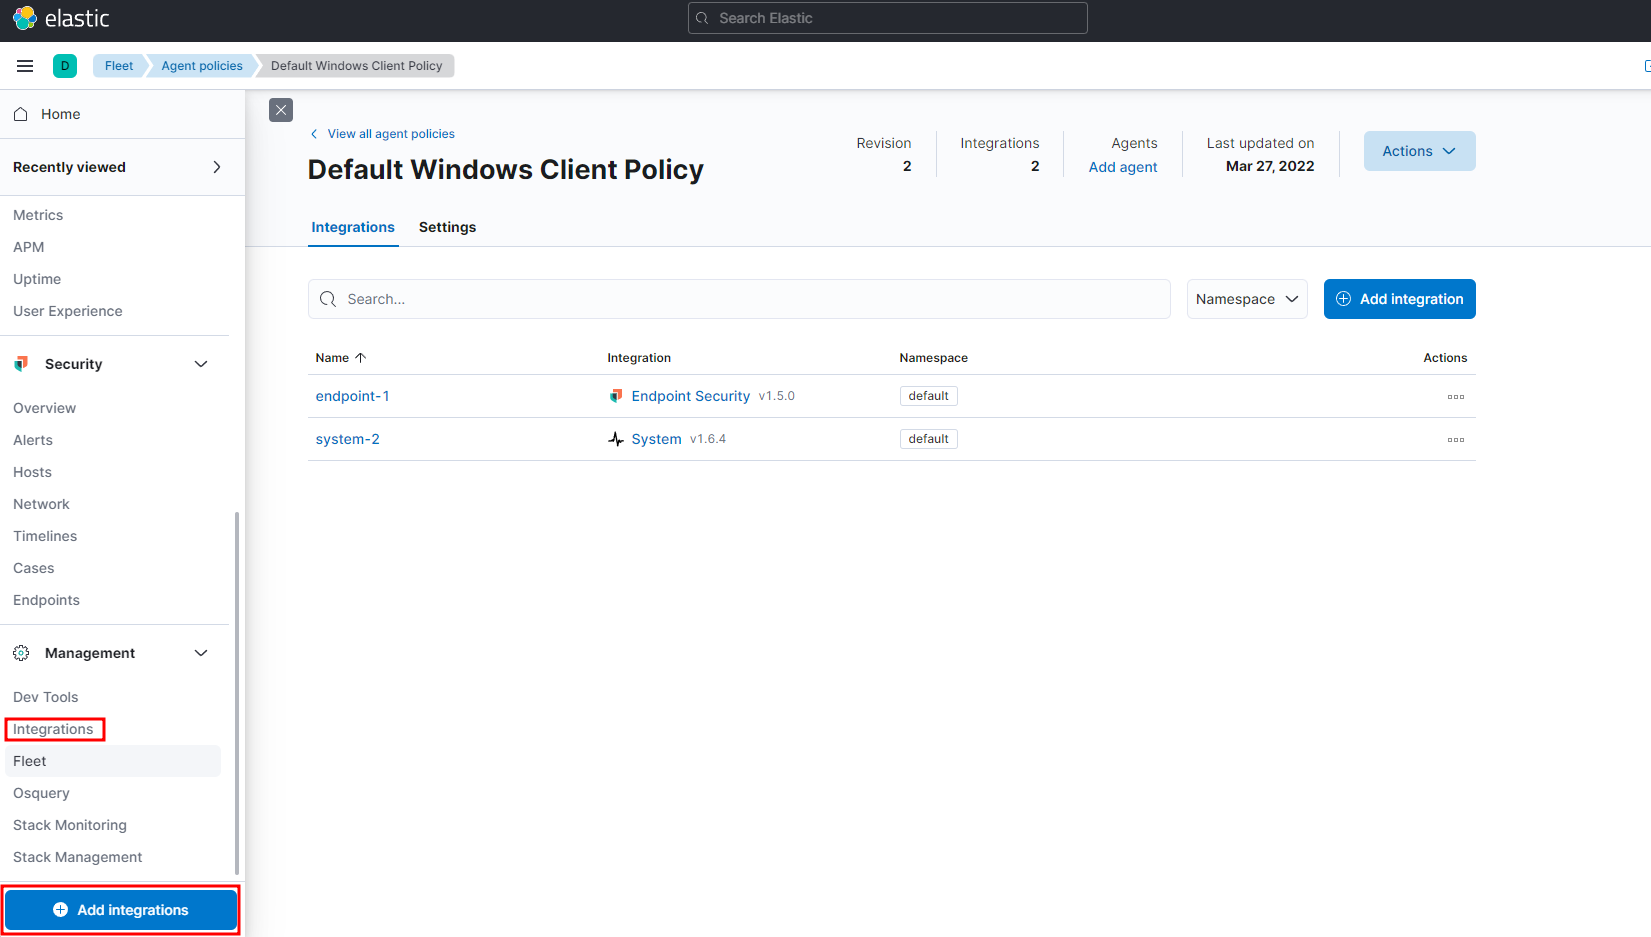
You’ll be prompted to Add Elastic Agent to your hosts, but we still need to add another integration. Select Add Elastic Agent later. Follow the same steps to add the Network Packet Capture integration. You can get back to integrations by selecting it under Management right above Fleet or the big blue button that appears at the bottom of the sidebar.
In the search bar, type Network Packet Capture and add the integration to our policy.
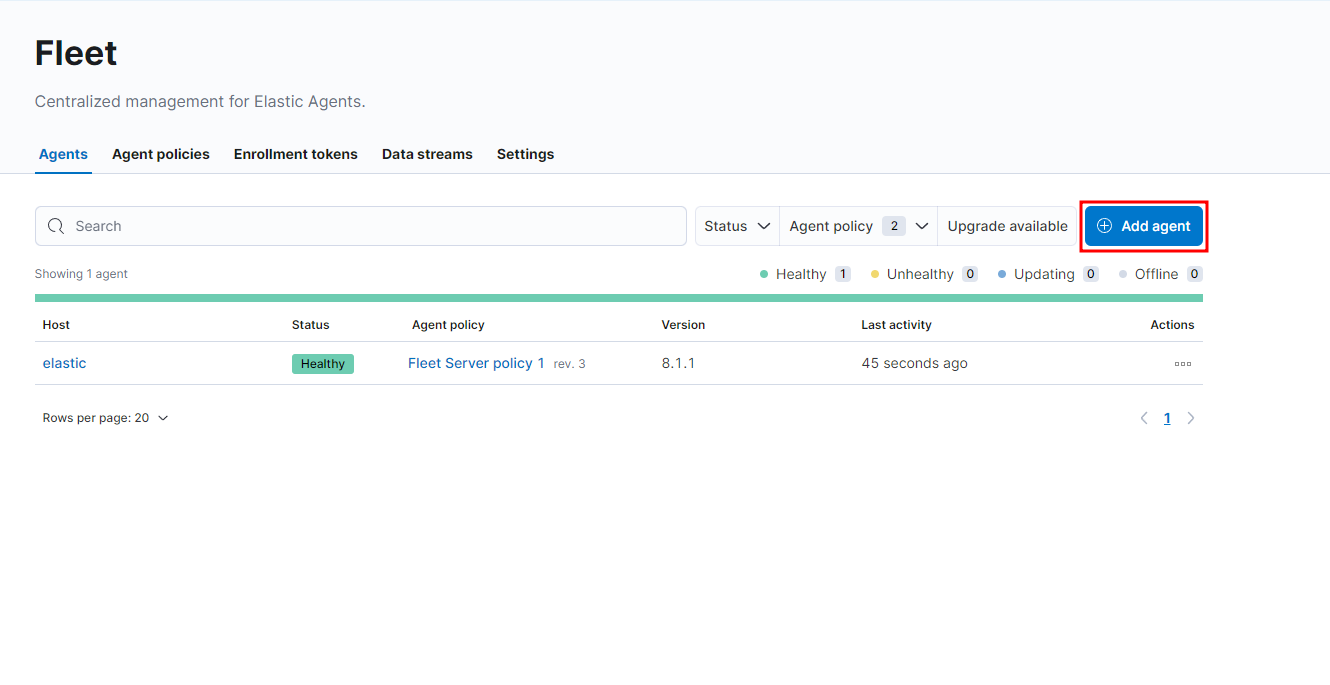
Now we can go ahead and Add Elastic Agent to your hosts here, or we can go back to our Fleet and add an agent there.
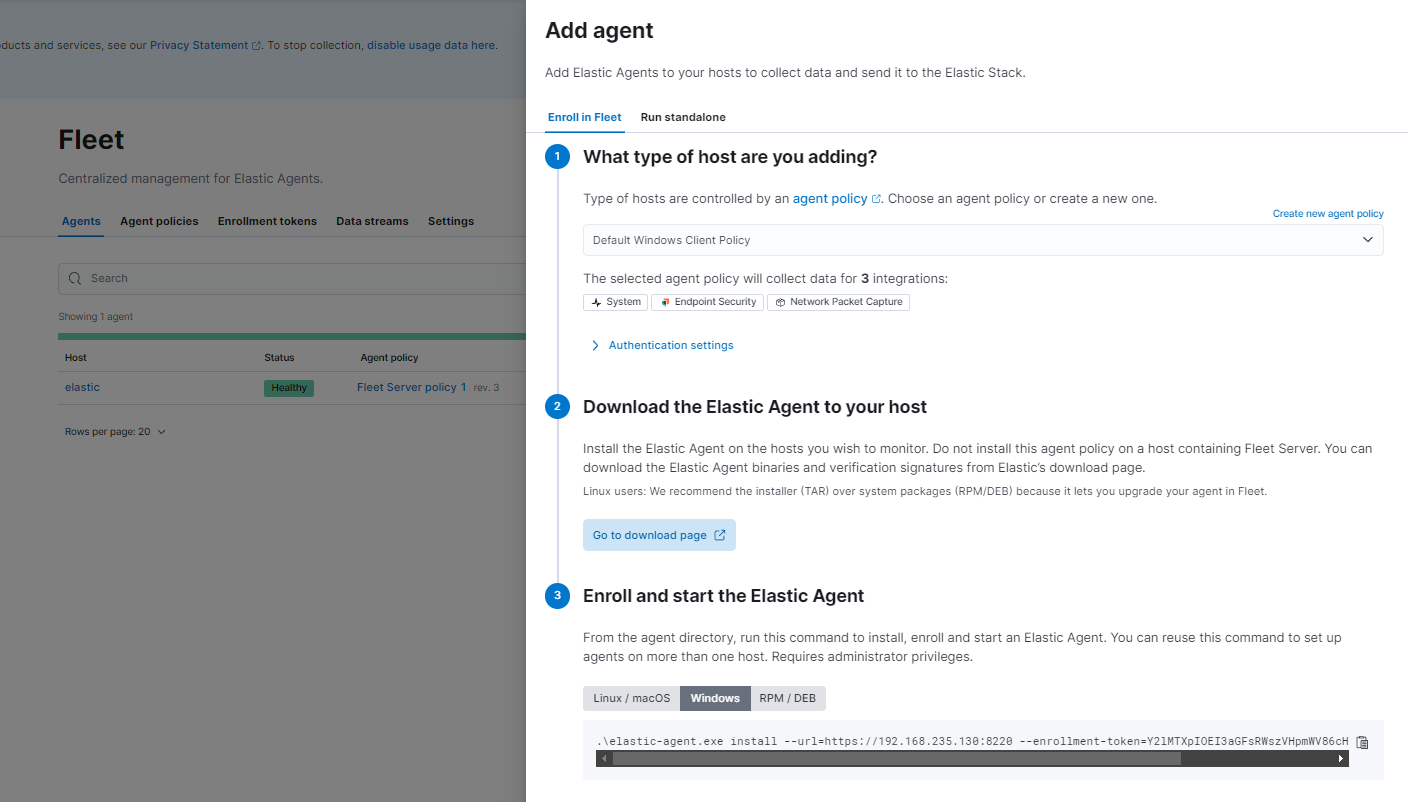
In Step 1, make sure our policy with Endpoint Security and Network Packet Capture is selected. Ignore Step 2. In Step 3, Select Windows.
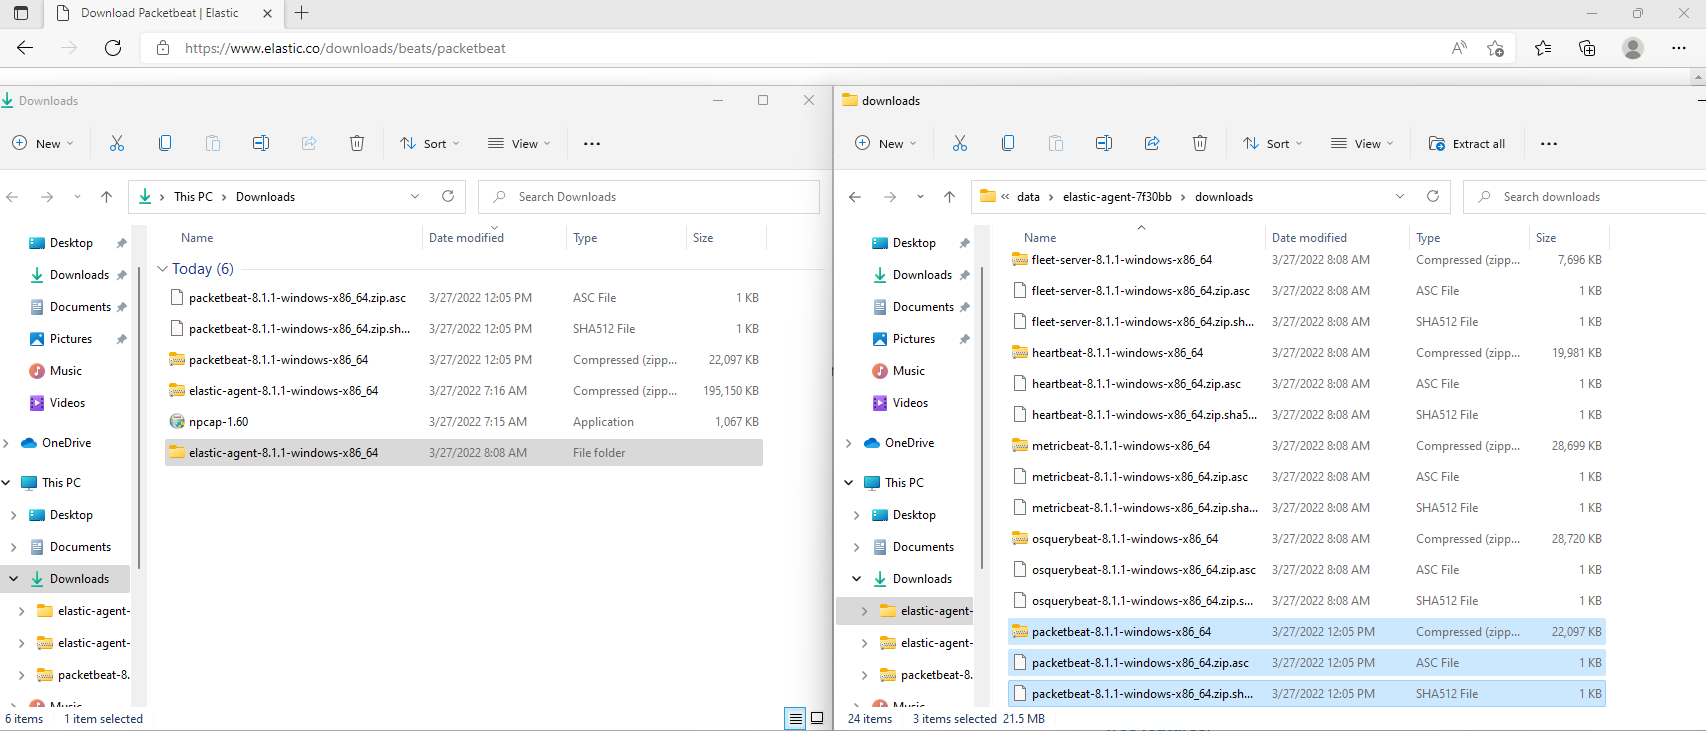
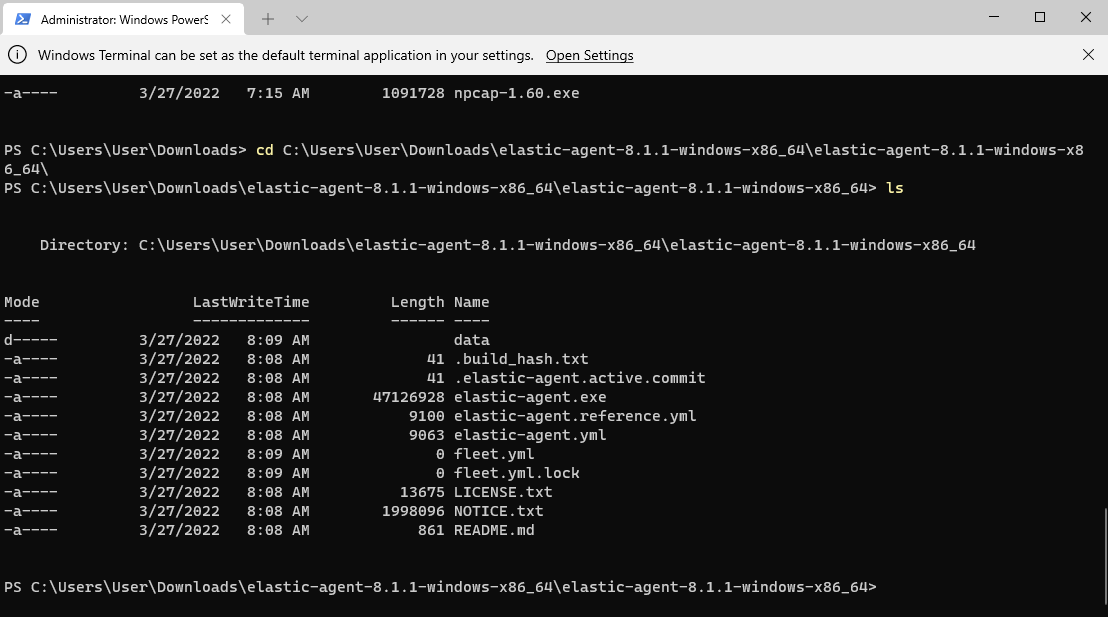
Before we copy and paste the command into Windows, we need to extract the contents of the elastic-agent zip file we downloaded. Then we need to copy and paste the three Packetbeat files we downloaded and paste them into the the newly extracted folder elastic-agent-8.1.1-windows-x86_64\data\elastic-agent-7f30bb\downloads\
Then we need to open a PowerShell or Cmd window with Administrator privileges. Navigate inside of the extracted elastic-agent-8.1.1-windows-x86_64\ directory. There should be an elastic-agent.exe executable there. Then we can copy and paste the command from Kibana.
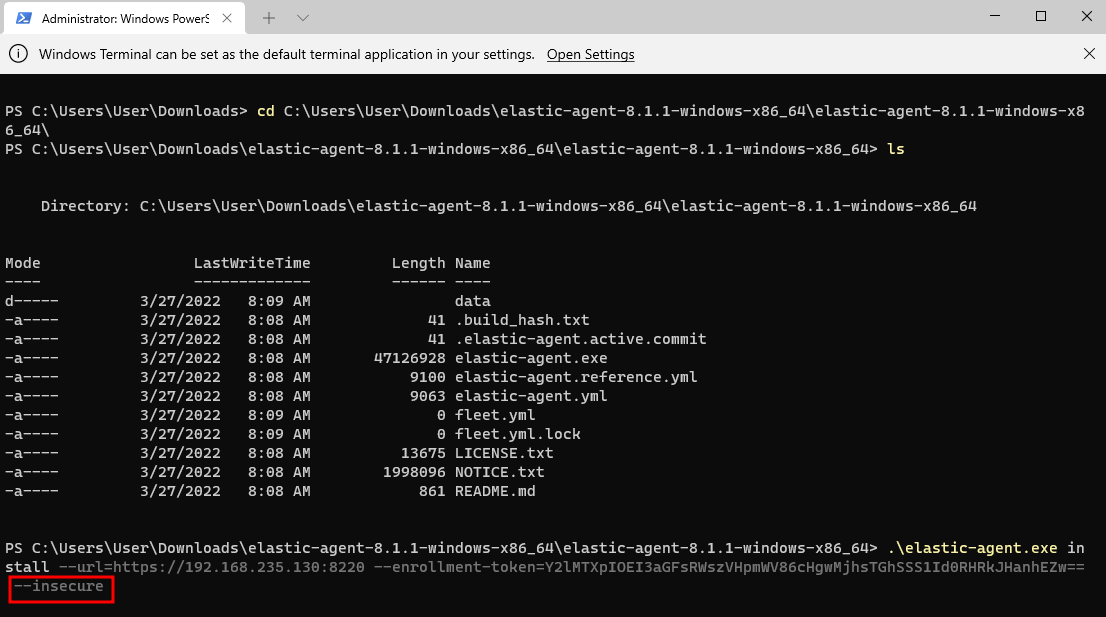
We’ll need to add a --insecure at the end of the command to enroll the Agent and to avoid an untrusted certificate error since these certs are self-signed.
If everything enrolled correctly, you should see the output:
1
2
Successfully enrolled the Elastic Agent.
Elastic Agent has been successfully installed.
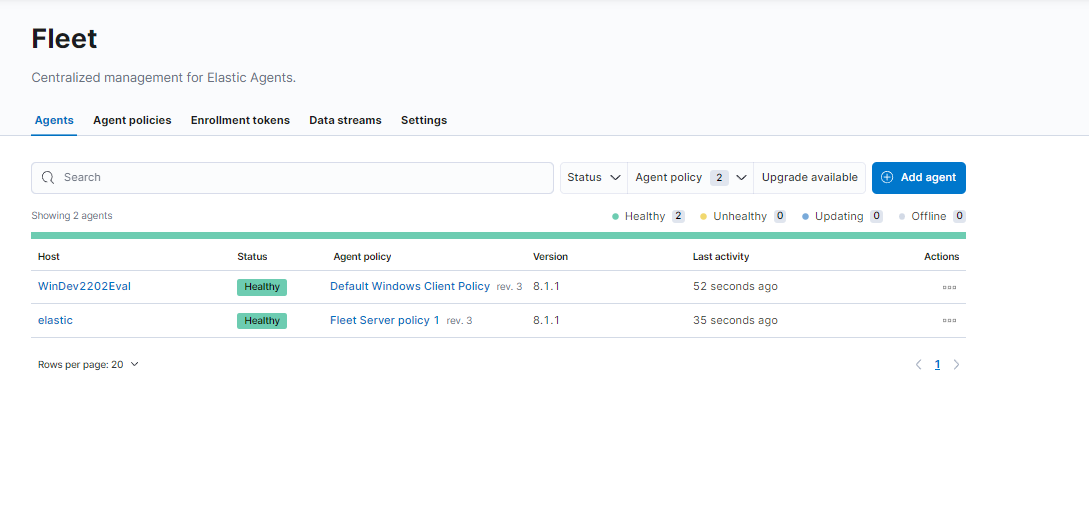
Then in Kibana we should see our new, healthy Agent
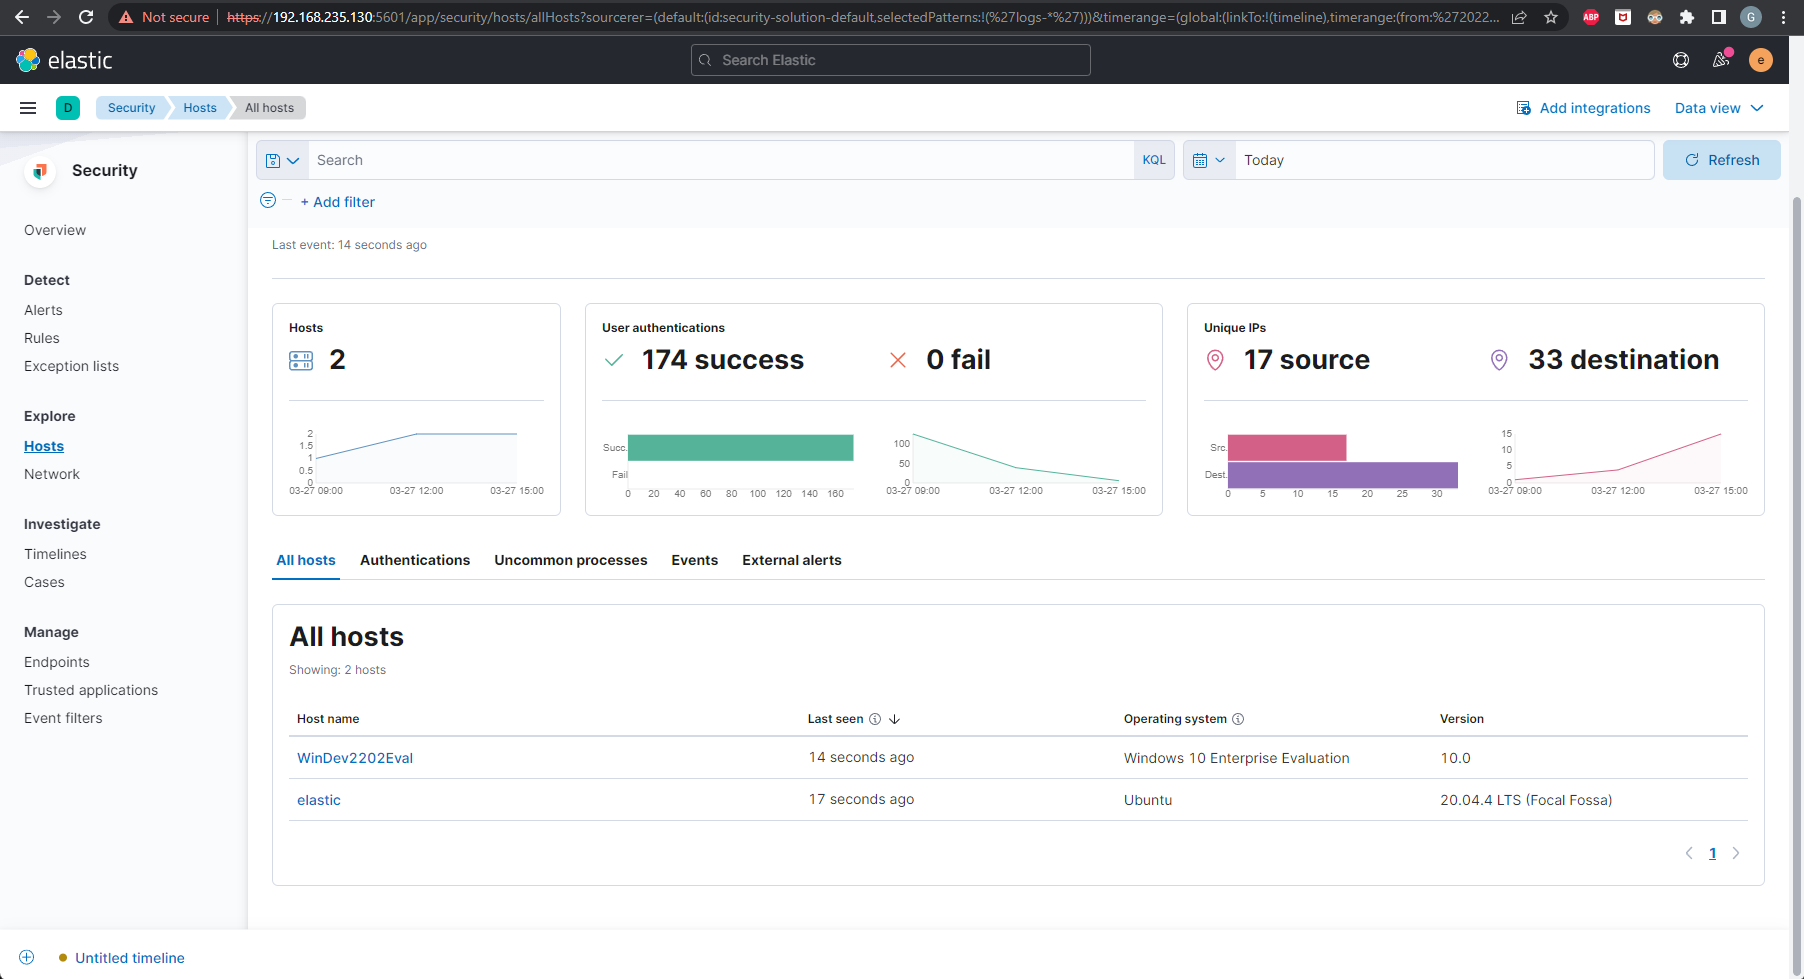
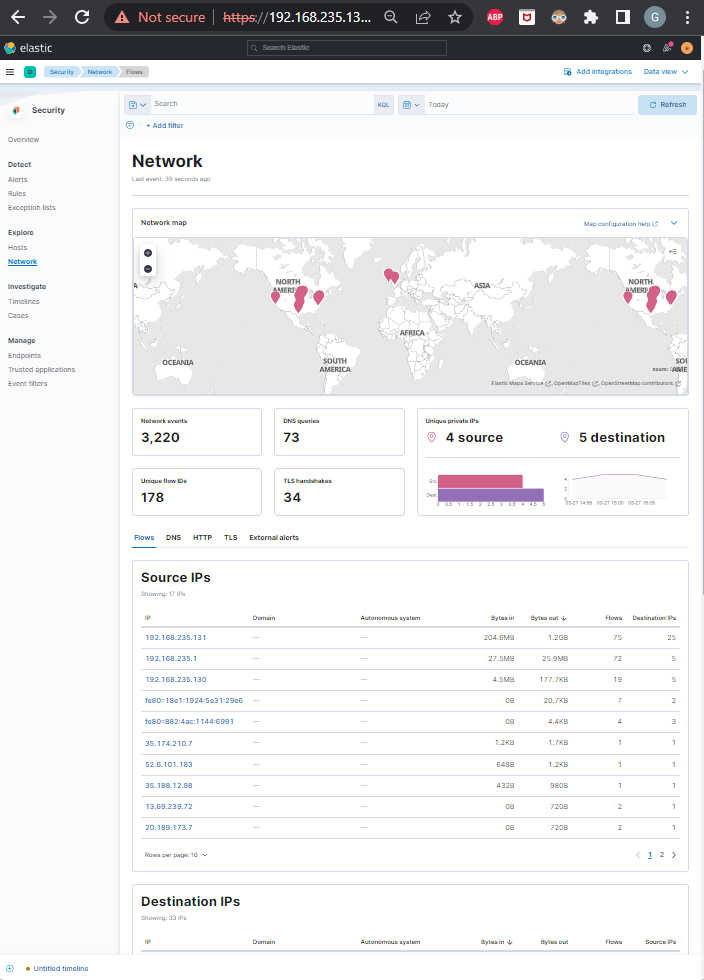
Now if we head over to Security in Kibana, we can check out Host and Network activity. Then we can load prebuilt Elastic rules under Detect and enable them.


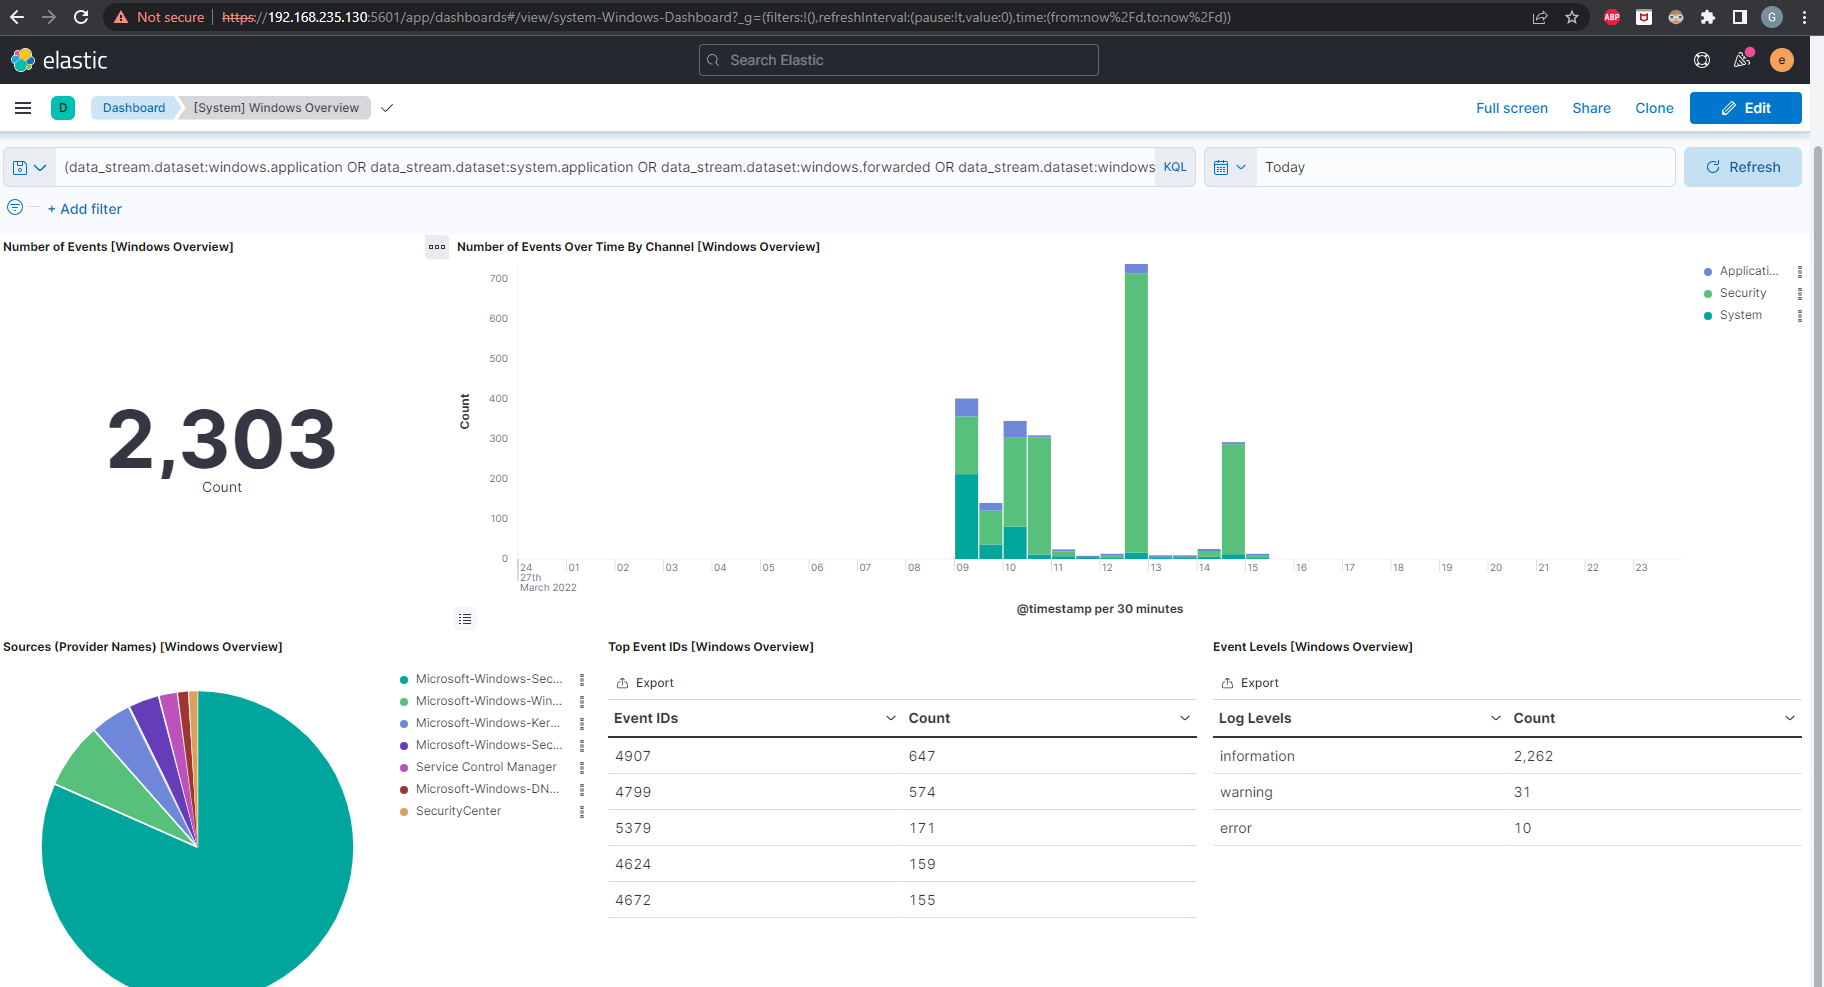
There are also some pre-built Dashboards you can use to visualize the data coming in.
All-In-One Script Install
https://github.com/gore-ez-knee/awesome-scripts/tree/main/elastic-quickstart-bare-metal
If you would like to setup up a single stack quickly and painlessly, I threw all of the commands into a script. Being that I installed this on a Debian/Ubuntu server, the script has been setup to install Debian packages only. Also this only works for Elastic version 8.0.0+ because Elastic v8 automatically creates TLS certificates for Elasticsearch communication and I haven’t put checks in to create and update Elasticsearch should someone want to install an older version.
The script requires that some sudo commands be run. This is for enabling services to autostart as well as modifying /etc files.
It also generates self-signed certificates to enable TLS between Kibana and one’s browser as well as for Fleet Server.
UPDATE 18 Apr 2022
Modified the script to automatically setup Fleet Server. I eventually realized I could use a proxy (Burp Suite) to capture the API calls used when manually setting up Fleet through the UI. Then I could create curl commands to set everything up in the script.
Still working on getting this setup with Docker the same way…
When ran, the output should look similar to this:
1
2
3
4
5
6
7
8
9
10
11
12
13
14
15
16
17
18
19
20
21
22
23
24
25
26
27
28
29
30
31
32
33
34
35
36
37
38
39
40
41
42
43
44
45
46
47
48
49
50
51
52
53
54
55
56
57
58
59
60
elastic-user@elastic:~$ sudo ./elastic_stack.sh
[sudo] password for elastic-user:
Select a number corresponding to the version you'd like to download:
0)  8.1.2
1)  8.1.1
2)  8.1.0
3)  8.0.1
4)  8.0.0
Enter number: 0
Select a number corresponding the Server's IP:
0)  192.168.235.133
Enter a number: 0
[*] Downloading Elasticsearch 8.1.1...
[*] Elasticsearch 8.1.1 Download Successful!
[*] Installing Elasticsearch 8.1.1...
[+] Elasticsearch 8.1.1 Installed!
[!] Important output saved in elasticsearch_install.out
[*] Enabling Elasticsearch to autostart...
[*] Starting Elasticsearch...
[+] Successful Connection to Elasticsearch! :)
[*] Generating Kibana Enrollment Token...
[*] Downloading Kibana 8.1.1...
[*] Kibana 8.1.1 Download Successful!
[*] Installing Kibana 8.1.1...
[+] Kibana Installed!
[*] Setting Up Kibana with Elasticsearch...
[+] Kibana Successfully Setup with Elasticsearch
[?] Would you like to add a password to your self-signed keys?(y/n): y
Password:
Password (again):
[*] Creating self-signed certificates...
[+] Certificates created!
[*] Modifying kibana.yml with new settings...
[*] Generating Encryption Keys for Kibana and writing them to kibana.yml
[*] Enabling Kibana to autostart...
[*] Starting Kibana...
================================================================
==              Elasticsearch & Kibana Installed              ==
================================================================
[*] Now go to https://SERVER_IP:5601
[*] Login with:
    Username: elastic
    Password: Z=9ZGo9Kgva3Rg1EsDpA
================================================================
[?] Would you like to setup a Fleet Server?(y/n): y
[*] Downloading Elastic Agent 8.1.1...
[*] Elastic Agent 8.1.1 Download Successful!
[*] Installing Elastic Agent 8.1.1...
[+] Elastic agent 8.1.1 Installed!
[*] Generating a CA to create Fleet Server Certificates
[!] Need to install Unzip binary
[*] Creating Certificates for Fleet Server
[*] Setting Up Fleet Agent Policy...DONE
[*] Snagging Service Token...DONE
[*] Getting Elasticsearch CA Fingerprint...DONE
[*] Adding Fleet Server host...DONE
[*] Enrolling Fleet...DONE
================================================================
==                   Fleet Server Installed                   ==
================================================================
To change the superuser password or generate enrollment tokens to add additional Elasticsearch nodes, the script outputs the initial config output to the file elasticsearch_install.out which gives the needed commands.